Gaming the Float: How Managers Respond to EPS-based Incentives
Gaming the Float: How Managers Respond to EPS-based Incentives
Gaming the Float: How Managers Respond to EPS-based Incentives

You also want an ePaper? Increase the reach of your titles
YUMPU automatically turns print PDFs into web optimized ePapers that Google loves.
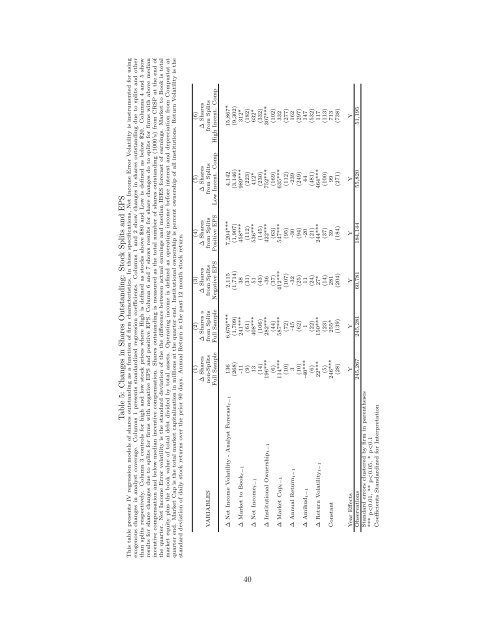
Table 5: Changes in Shares Outstanding: S<strong>to</strong>ck Splits and <strong>EPS</strong><br />
This table presents IV regression models of shares outstanding as a function of firm characteristics. In <strong>the</strong>se specifications, Net Income Error Volatility is instrumented for using<br />
exogenous changes in analyst coverage. Columns 1 presents standardized regression coefficients. Columns 1 and 2 show changes in shares outstanding due <strong>to</strong> splits and o<strong>the</strong>r<br />
than splits respectively. Column 3 controls for high and low s<strong>to</strong>ck prices where High is defined as s<strong>to</strong>cks above $80 and Low is defined as below $20. Columns 4 and 5 show<br />
results for share changes due <strong>to</strong> splits for firms with negative <strong>EPS</strong> and positive <strong>EPS</strong>. Column 6 and 7 shows results for share changes do <strong>to</strong> splits for firms with above median<br />
incentive compensation and below median incentive compensation. Shares outstanding is measured as <strong>the</strong> <strong>to</strong>tal number of shares outstanding (1000’s) from CRSP at <strong>the</strong> end of<br />
<strong>the</strong> quarter. Net Income Error volatility is <strong>the</strong> standard deviation of <strong>the</strong> <strong>the</strong> difference between actual earnings and median IBES forecast of earnings. Market <strong>to</strong> Book is <strong>to</strong>tal<br />
market equity plus <strong>the</strong> book value of <strong>to</strong>tal debt divided by <strong>to</strong>tal assets. Operating income is defined as operating income before interest and depreciation from Compustat at<br />
quarter end. Market Cap is <strong>the</strong> <strong>to</strong>tal market capitalization in millions at <strong>the</strong> quarter end. Institutional ownership is percent ownership of all institutions. Return Volatility is <strong>the</strong><br />
standard deviation of daily s<strong>to</strong>ck returns over <strong>the</strong> prior 90 days. Annual Return is <strong>the</strong> past 12 month s<strong>to</strong>ck return.<br />
(1) (2) (3) (4) (5) (6)<br />
∆ Shares ∆ Shares s ∆ Shares ∆ Shares ∆ Shares ∆ Shares<br />
VARIABLES non-Splits from Splits from Splits from Splits from Splits from Splits<br />
Full Sample Full Sample Negative <strong>EPS</strong> Positive <strong>EPS</strong> Low Incent. Comp High Incent. Comp<br />
∆ Net Income Volatility - Analyst Forecastt−1 136 6,676*** 2,115 7,204*** 4,142 15,867*<br />
(268) (1,709) (1,714) (1,907) (3,146) (9,302)<br />
∆ Market <strong>to</strong> Bookt−1 -11 241*** 38 458*** 989*** 312*<br />
(9) (61) (31) (112) (223) (182)<br />
∆ Net Incomet−1 13 408*** 51 536*** 412* 632*<br />
(14) (106) (43) (145) (230) (332)<br />
∆ Institutional Ownershipt−1 196*** 282*** -36 422*** 752*** 307***<br />
(6) (44) (37) (63) (169) (102)<br />
∆ Market Capt−1 114*** 587*** 412*** 547*** 635*** 332<br />
(10) (72) (107) (95) (112) (277)<br />
∆ Annual Returnt−1 3 -45 -32 -30 -239 162<br />
(10) (62) (25) (94) (249) (297)<br />
∆ Amihudt−1 -40*** 1 11 -20 44 147<br />
(6) (22) (24) (21) (481) (532)<br />
∆ Return Volatilityt−1 22*** 150*** 27* 244*** 464*** 117<br />
(5) (23) (14) (37) (100) (113)<br />
Constant 246*** 255* 281 39 99 713<br />
(28) (139) (204) (184) (271) (738)<br />
Year Effects Y Y Y Y Y Y<br />
Observations 245,267 245,281 60,781 184,144 55,820 51,195<br />
Standard errors clustered by firm in paren<strong>the</strong>ses<br />
*** p