Gaming the Float: How Managers Respond to EPS-based Incentives
Gaming the Float: How Managers Respond to EPS-based Incentives
Gaming the Float: How Managers Respond to EPS-based Incentives

You also want an ePaper? Increase the reach of your titles
YUMPU automatically turns print PDFs into web optimized ePapers that Google loves.
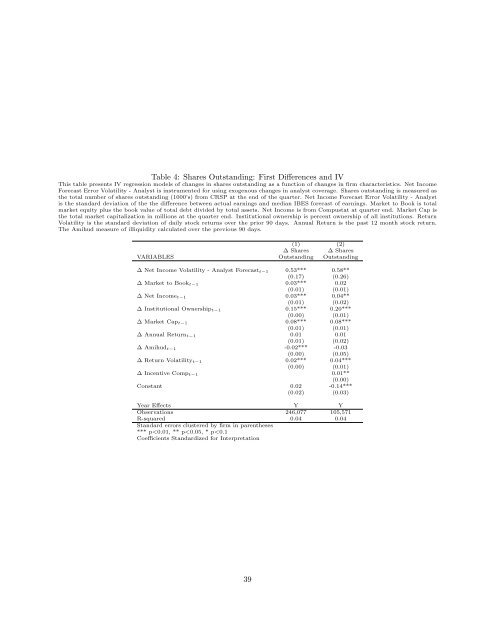
Table 4: Shares Outstanding: First Differences and IV<br />
This table presents IV regression models of changes in shares outstanding as a function of changes in firm characteristics. Net Income<br />
Forecast Error Volatility - Analyst is instrumented for using exogenous changes in analyst coverage. Shares outstanding is measured as<br />
<strong>the</strong> <strong>to</strong>tal number of shares outstanding (1000’s) from CRSP at <strong>the</strong> end of <strong>the</strong> quarter. Net Income Forecast Error Volatility - Analyst<br />
is <strong>the</strong> standard deviation of <strong>the</strong> <strong>the</strong> difference between actual earnings and median IBES forecast of earnings. Market <strong>to</strong> Book is <strong>to</strong>tal<br />
market equity plus <strong>the</strong> book value of <strong>to</strong>tal debt divided by <strong>to</strong>tal assets. Net Income is from Compustat at quarter end. Market Cap is<br />
<strong>the</strong> <strong>to</strong>tal market capitalization in millions at <strong>the</strong> quarter end. Institutional ownership is percent ownership of all institutions. Return<br />
Volatility is <strong>the</strong> standard deviation of daily s<strong>to</strong>ck returns over <strong>the</strong> prior 90 days. Annual Return is <strong>the</strong> past 12 month s<strong>to</strong>ck return.<br />
The Amihud measure of illiquidity calculated over <strong>the</strong> previous 90 days.<br />
(1) (2)<br />
∆ Shares ∆ Shares<br />
VARIABLES Outstanding Outstanding<br />
∆ Net Income Volatility - Analyst Forecast t−1 0.53*** 0.58**<br />
(0.17) (0.26)<br />
∆ Market <strong>to</strong> Book t−1 0.03*** 0.02<br />
(0.01) (0.01)<br />
∆ Net Income t−1 0.03*** 0.04**<br />
(0.01) (0.02)<br />
∆ Institutional Ownership t−1 0.15*** 0.20***<br />
(0.00) (0.01)<br />
∆ Market Cap t−1 0.08*** 0.08***<br />
(0.01) (0.01)<br />
∆ Annual Return t−1 0.01 0.01<br />
(0.01) (0.02)<br />
∆ Amihud t−1 -0.02*** -0.03<br />
(0.00) (0.05)<br />
∆ Return Volatility t−1 0.02*** 0.04***<br />
(0.00) (0.01)<br />
∆ Incentive Comp t−1 0.01**<br />
(0.00)<br />
Constant 0.02 -0.14***<br />
(0.02) (0.03)<br />
Year Effects Y Y<br />
Observations 246,077 105,571<br />
R-squared 0.04 0.04<br />
Standard errors clustered by firm in paren<strong>the</strong>ses<br />
*** p