Gaming the Float: How Managers Respond to EPS-based Incentives
Gaming the Float: How Managers Respond to EPS-based Incentives
Gaming the Float: How Managers Respond to EPS-based Incentives

Create successful ePaper yourself
Turn your PDF publications into a flip-book with our unique Google optimized e-Paper software.
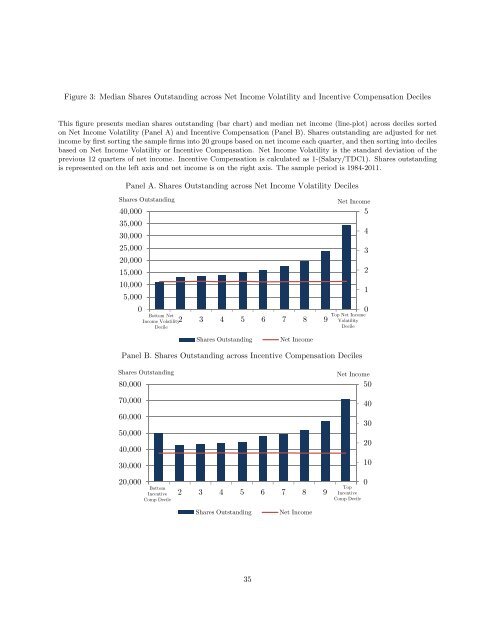
Figure 3: Median Shares Outstanding across Net Income Volatility and Incentive Compensation Deciles<br />
This figure presents median shares outstanding (bar chart) and median net income (line-plot) across deciles sorted<br />
on Net Income Volatility (Panel A) and Incentive Compensation (Panel B). Shares outstanding are adjusted for net<br />
income by first sorting <strong>the</strong> sample firms in<strong>to</strong> 20 groups <strong>based</strong> on net income each quarter, and <strong>the</strong>n sorting in<strong>to</strong> deciles<br />
<strong>based</strong> on Net Income Volatility or Incentive Compensation. Net Income Volatility is <strong>the</strong> standard deviation of <strong>the</strong><br />
previous 12 quarters of net income. Incentive Compensation is calculated as 1-(Salary/TDC1). Shares outstanding<br />
is represented on <strong>the</strong> left axis and net income is on <strong>the</strong> right axis. The sample period is 1984-2011.<br />
Panel A. Shares Outstanding across Net Income Volatility Deciles<br />
Shares Outstanding<br />
40,000<br />
35,000<br />
30,000<br />
25,000<br />
20,000<br />
15,000<br />
10,000<br />
5,000<br />
0<br />
Bot<strong>to</strong>m Net<br />
Income Volatility<br />
Decile<br />
2 3 4 5 6 7 8 9<br />
Net Income<br />
5<br />
Top Net Income<br />
Volatility<br />
Decile<br />
4<br />
3<br />
2<br />
1<br />
0<br />
Shares Outstanding<br />
Net Income<br />
Panel B. Shares Outstanding across Incentive Compensation Deciles<br />
Shares Outstanding<br />
80,000<br />
70,000<br />
60,000<br />
50,000<br />
40,000<br />
30,000<br />
20,000<br />
Bot<strong>to</strong>m<br />
Incentive<br />
Comp Decile<br />
2 3 4 5 6 7 8 9<br />
Net Income<br />
50<br />
40<br />
30<br />
20<br />
10<br />
0<br />
Top<br />
Incentive<br />
Comp Decile<br />
Shares Outstanding<br />
Net Income<br />
35