Gaming the Float: How Managers Respond to EPS-based Incentives
Gaming the Float: How Managers Respond to EPS-based Incentives
Gaming the Float: How Managers Respond to EPS-based Incentives

You also want an ePaper? Increase the reach of your titles
YUMPU automatically turns print PDFs into web optimized ePapers that Google loves.
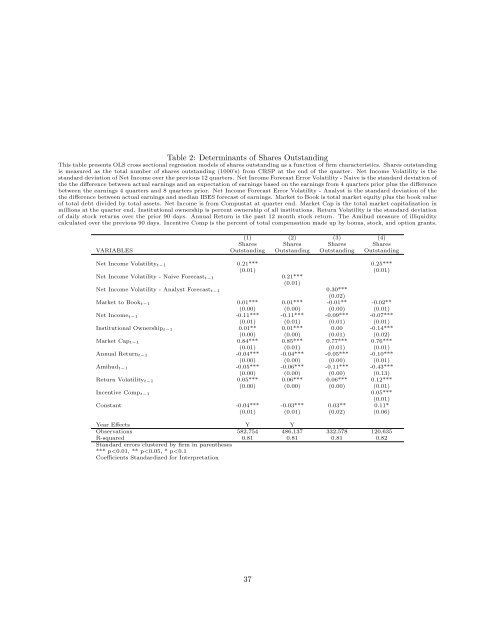
Table 2: Determinants of Shares Outstanding<br />
This table presents OLS cross sectional regression models of shares outstanding as a function of firm characteristics. Shares outstanding<br />
is measured as <strong>the</strong> <strong>to</strong>tal number of shares outstanding (1000’s) from CRSP at <strong>the</strong> end of <strong>the</strong> quarter. Net Income Volatility is <strong>the</strong><br />
standard deviation of Net Income over <strong>the</strong> previous 12 quarters. Net Income Forecast Error Volatility - Naive is <strong>the</strong> standard deviation of<br />
<strong>the</strong> <strong>the</strong> difference between actual earnings and an expectation of earnings <strong>based</strong> on <strong>the</strong> earnings from 4 quarters prior plus <strong>the</strong> difference<br />
between <strong>the</strong> earnings 4 quarters and 8 quarters prior. Net Income Forecast Error Volatility - Analyst is <strong>the</strong> standard deviation of <strong>the</strong><br />
<strong>the</strong> difference between actual earnings and median IBES forecast of earnings. Market <strong>to</strong> Book is <strong>to</strong>tal market equity plus <strong>the</strong> book value<br />
of <strong>to</strong>tal debt divided by <strong>to</strong>tal assets. Net Income is from Compustat at quarter end. Market Cap is <strong>the</strong> <strong>to</strong>tal market capitalization in<br />
millions at <strong>the</strong> quarter end. Institutional ownership is percent ownership of all institutions. Return Volatility is <strong>the</strong> standard deviation<br />
of daily s<strong>to</strong>ck returns over <strong>the</strong> prior 90 days. Annual Return is <strong>the</strong> past 12 month s<strong>to</strong>ck return. The Amihud measure of illiquidity<br />
calculated over <strong>the</strong> previous 90 days. Incentive Comp is <strong>the</strong> percent of <strong>to</strong>tal compensation made up by bonus, s<strong>to</strong>ck, and option grants.<br />
(1) (2) (3) (4)<br />
Shares Shares Shares Shares<br />
VARIABLES Outstanding Outstanding Outstanding Outstanding<br />
Net Income Volatility t−1 0.21*** 0.25***<br />
(0.01) (0.01)<br />
Net Income Volatility - Naive Forecast t−1 0.21***<br />
(0.01)<br />
Net Income Volatility - Analyst Forecast t−1 0.30***<br />
(0.02)<br />
Market <strong>to</strong> Book t−1 0.01*** 0.01*** -0.01** -0.02**<br />
(0.00) (0.00) (0.00) (0.01)<br />
Net Income t−1 -0.11*** -0.11*** -0.09*** -0.07***<br />
(0.01) (0.01) (0.01) (0.01)<br />
Institutional Ownership t−1 0.01** 0.01*** 0.00 -0.14***<br />
(0.00) (0.00) (0.01) (0.02)<br />
Market Cap t−1 0.84*** 0.85*** 0.77*** 0.76***<br />
(0.01) (0.01) (0.01) (0.01)<br />
Annual Return t−1 -0.04*** -0.04*** -0.05*** -0.10***<br />
(0.00) (0.00) (0.00) (0.01)<br />
Amihud t−1 -0.05*** -0.06*** -0.11*** -0.43***<br />
(0.00) (0.00) (0.00) (0.13)<br />
Return Volatility t−1 0.05*** 0.06*** 0.06*** 0.12***<br />
(0.00) (0.00) (0.00) (0.01)<br />
Incentive Comp t−1 0.05***<br />
(0.01)<br />
Constant -0.04*** -0.03*** 0.03** 0.11*<br />
(0.01) (0.01) (0.02) (0.06)<br />
Year Effects Y Y<br />
Observations 582,754 486,137 332,578 120,635<br />
R-squared 0.81 0.81 0.81 0.82<br />
Standard errors clustered by firm in paren<strong>the</strong>ses<br />
*** p