- Page 1 and 2:
ADVANCED SERIES TRUST AST Horizon M
- Page 3 and 4:
ADVANCED SERIES TRUST AST Bond Port
- Page 5 and 6:
V. In the SAI, the following is add
- Page 7 and 8:
AST Academic Strategies Asset Alloc
- Page 9 and 10:
AST Bond Portfolio 2015 Annual Port
- Page 11 and 12:
AST Bond Portfolio 2019 Annual Port
- Page 13 and 14:
AST Bond Portfolio 2023 Annual Port
- Page 15 and 16:
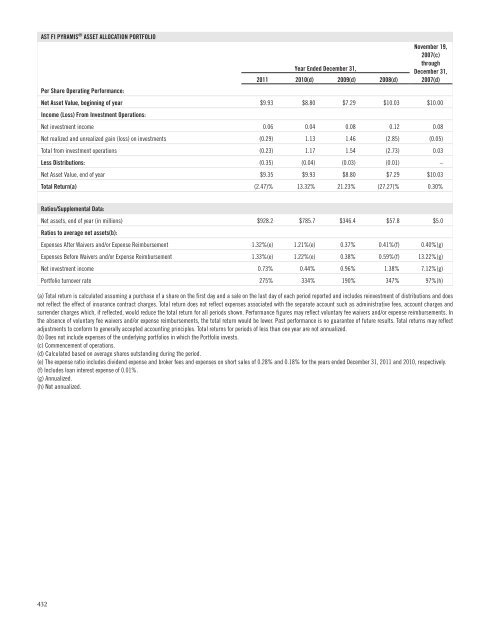
AST FI Pyramis ® Asset Allocation
- Page 17 and 18:
AST Global Real Estate Portfolio An
- Page 19 and 20:
AST Goldman Sachs Small-Cap Value P
- Page 21 and 22:
AST Investment Grade Bond Portfolio
- Page 23 and 24:
AST J.P. Morgan International Equit
- Page 25 and 26:
AST Marsico Capital Growth Portfoli
- Page 27 and 28:
AST Mid-Cap Value Portfolio Annual
- Page 29 and 30:
AST Neuberger Berman Mid-Cap Growth
- Page 31 and 32:
AST PIMCO Limited Maturity Bond Por
- Page 33 and 34:
AST Schroders Global Tactical Portf
- Page 35 and 36:
AST T. Rowe Price Asset Allocation
- Page 37 and 38:
AST T. Rowe Price Natural Resources
- Page 39 and 40:
II. The section of the Prospectus e
- Page 41 and 42:
The Board has approved (i) replacin
- Page 43 and 44:
index, the Portfolio is not an "ind
- Page 45 and 46:
C. All references to the Portfolio
- Page 47 and 48:
to subadvisory fees paid by Prudent
- Page 49 and 50:
ADVANCED SERIES TRUST Supplement da
- Page 51 and 52:
ADVANCED SERIES TRUST AST Academic
- Page 53 and 54:
ADVANCED SERIES TRUST AST CLS Moder
- Page 55 and 56:
AST Neuberger Berman Core Bond 1.16
- Page 57 and 58:
ADVANCED SERIES TRUST Supplement da
- Page 59 and 60:
5/$0.2* Kevin W. Bedell 7/$2.2 1 /$
- Page 61 and 62:
Fixed-Income Core and Core Plus Fix
- Page 63 and 64:
ADVANCED SERIES TRUST PROSPECTUS DA
- Page 65 and 66:
Example. The following example is i
- Page 67 and 68:
securities, asset-backed securities
- Page 69 and 70:
treatment under current tax laws. I
- Page 71 and 72:
AST J.P. Morgan Portfolio’s minim
- Page 75 and 76:
ADVANCED SERIES TRUST AST Schroders
- Page 77 and 78:
ASTSUP4 ADVANCED SERIES TRUST Suppl
- Page 79 and 80:
value, among other factors, is also
- Page 81 and 82:
ADVANCED SERIES TRUST AST Marsico C
- Page 83 and 84:
AST BlackRock Value Portfolio * Sub
- Page 85 and 86:
III. The table under the heading Pa
- Page 87 and 88:
Table of Contents 1 SUMMARY: AST AC
- Page 89 and 90:
Fund of funds risk. In addition to
- Page 91 and 92:
Past Performance. A number of facto
- Page 93 and 94:
SUMMARY: AST ADVANCED STRATEGIES PO
- Page 95 and 96:
Liquidity and valuation risk. From
- Page 97 and 98:
SUMMARY: AST BALANCED ASSET ALLOCAT
- Page 99 and 100:
The Portfolio invests in securities
- Page 101 and 102:
SUMMARY: AST BLACKROCK GLOBAL STRAT
- Page 103 and 104:
Derivatives risk. A derivative is a
- Page 105 and 106:
SUMMARY: AST BLACKROCK VALUE PORTFO
- Page 107 and 108:
The table also demonstrates how the
- Page 109 and 110:
The Portfolio is managed to mature
- Page 111 and 112:
MANAGEMENT OF THE PORTFOLIO Investm
- Page 113 and 114:
The Portfolio is managed to mature
- Page 115 and 116:
MANAGEMENT OF THE PORTFOLIO Investm
- Page 117 and 118:
The Portfolio is managed to mature
- Page 119 and 120:
MANAGEMENT OF THE PORTFOLIO Investm
- Page 121 and 122:
The Portfolio is managed to mature
- Page 123 and 124:
MANAGEMENT OF THE PORTFOLIO Investm
- Page 125 and 126:
The Portfolio is managed to mature
- Page 127 and 128:
MANAGEMENT OF THE PORTFOLIO Investm
- Page 129 and 130:
The Portfolio is managed to mature
- Page 131 and 132:
MANAGEMENT OF THE PORTFOLIO Investm
- Page 133 and 134:
The Portfolio is managed to mature
- Page 135 and 136:
MANAGEMENT OF THE PORTFOLIO Investm
- Page 137 and 138:
The Portfolio is managed to mature
- Page 139 and 140:
SUMMARY: AST BOND PORTFOLIO 2023 IN
- Page 141 and 142:
U.S. government-related organizatio
- Page 143 and 144:
Principal Risks of Investing in the
- Page 145 and 146:
Average Annual Total Returns (For t
- Page 147 and 148:
Under normal circumstances, no more
- Page 149 and 150:
Annual Total Returns 40% 20% 23.39
- Page 151 and 152:
the value of a REIT is subject to a
- Page 153 and 154:
FINANCIAL INTERMEDIARY COMPENSATION
- Page 155 and 156:
Equity securities risk. There is th
- Page 157 and 158:
Annual Total Returns 80% 69.16 60%
- Page 159 and 160:
Strategy Description Estimated Perc
- Page 161 and 162:
Liquidity and valuation risk. From
- Page 163 and 164:
SUMMARY: AST FIRST TRUST BALANCED T
- Page 165 and 166:
Expense risk. Your actual cost of i
- Page 167 and 168:
SUMMARY: AST FIRST TRUST CAPITAL AP
- Page 169 and 170:
Expense risk. Your actual cost of i
- Page 171 and 172:
SUMMARY: AST FRANKLIN TEMPLETON FOU
- Page 173 and 174:
Derivatives risk. A derivative is a
- Page 175 and 176:
FINANCIAL INTERMEDIARY COMPENSATION
- Page 177 and 178:
the value of a REIT is subject to a
- Page 179 and 180:
SUMMARY: AST GOLDMAN SACHS CONCENTR
- Page 181 and 182:
The table also demonstrates how the
- Page 183 and 184:
Equity securities risk. There is th
- Page 185 and 186:
SUMMARY: AST GOLDMAN SACHS MID-CAP
- Page 187 and 188:
Annual Total Returns 80% 60% 57.09
- Page 189 and 190:
Value style risk. There is a risk t
- Page 191 and 192:
SUMMARY: AST HIGH YIELD PORTFOLIO I
- Page 193 and 194:
Liquidity and valuation risk. From
- Page 195 and 196:
SUMMARY: AST HORIZON GROWTH ASSET A
- Page 197 and 198:
Asset-backed securities risk. Asset
- Page 199 and 200:
Investment Managers Subadviser Port
- Page 201 and 202:
Under normal circumstances, no more
- Page 203 and 204:
The annual returns and average annu
- Page 205 and 206:
SUMMARY: AST INTERNATIONAL GROWTH P
- Page 207 and 208:
Annual Total Returns 60% 40% 39.95
- Page 209 and 210:
Foreign investment risk. Investment
- Page 211 and 212:
SUMMARY: AST INVESTMENT GRADE BOND
- Page 213 and 214:
usually differ from those in the U.
- Page 215 and 216:
SUMMARY: AST JENNISON LARGE-CAP GRO
- Page 217 and 218:
Annual Total Returns 15% 11.32 10%
- Page 219 and 220:
Value style risk. There is a risk t
- Page 221 and 222:
SUMMARY: AST JPMORGAN INTERNATIONAL
- Page 223 and 224:
Annual Total Returns 60% 40% 20% 30
- Page 225 and 226:
Anticipated Asset Class Approximate
- Page 227 and 228:
Annual Total Returns 30% 20% 10% 0%
- Page 229 and 230:
Market and management risk. Markets
- Page 231 and 232:
SUMMARY: AST LORD ABBETT CORE FIXED
- Page 233 and 234:
exchange-traded derivatives may be
- Page 235 and 236:
SUMMARY: AST MARSICO CAPITAL GROWTH
- Page 237 and 238:
Annual Total Returns 60% 40% 20% 31
- Page 239 and 240:
Equity securities risk. There is th
- Page 241 and 242:
SUMMARY: AST MFS GROWTH PORTFOLIO I
- Page 243 and 244:
Annual Total Returns 60% 40% 20% 22
- Page 245 and 246:
Mid-capitalization company risk. Th
- Page 247 and 248:
SUMMARY: AST MONEY MARKET PORTFOLIO
- Page 249 and 250:
Index Lipper Variable Insurance Pro
- Page 251 and 252:
Market and management risk. Markets
- Page 253 and 254:
SUMMARY: AST NEUBERGER BERMAN MID-C
- Page 255 and 256:
Average Annual Total Returns (For t
- Page 257 and 258:
Market and management risk. Markets
- Page 259 and 260:
SUMMARY: AST NEW DISCOVERY ASSET AL
- Page 261 and 262:
High-yield risk. Investments in fix
- Page 263 and 264:
SUMMARY: AST PARAMETRIC EMERGING MA
- Page 265 and 266:
Past Performance. A number of facto
- Page 267 and 268:
(liquidity risk); and the risk that
- Page 269 and 270:
SUMMARY: AST PIMCO TOTAL RETURN BON
- Page 271 and 272:
the Portfolio and other Portfolios
- Page 273 and 274:
SUMMARY: AST PRESERVATION ASSET ALL
- Page 275 and 276:
comparable to those in the U.S, and
- Page 277 and 278:
SUMMARY: AST PRUDENTIAL CORE BOND P
- Page 279 and 280:
Derivatives risk. A derivative is a
- Page 281 and 282:
In rising markets, the Portfolio ex
- Page 283 and 284:
FINANCIAL INTERMEDIARY COMPENSATION
- Page 285 and 286:
(NAV) per share. In general terms,
- Page 287 and 288:
U.S. government-related organizatio
- Page 289 and 290:
SUMMARY: AST SCHRODERS GLOBAL TACTI
- Page 291 and 292:
Equity securities risk. There is th
- Page 293 and 294:
MANAGEMENT OF THE PORTFOLIO Investm
- Page 295 and 296:
Fund of funds risk. In addition to
- Page 297 and 298:
The table also demonstrates how the
- Page 299 and 300:
Growth style risk. There is a risk
- Page 301 and 302:
SUMMARY: AST SMALL-CAP VALUE PORTFO
- Page 303 and 304:
The annual returns and average annu
- Page 305 and 306:
Fixed income securities risk. Inves
- Page 307 and 308:
MANAGEMENT OF THE PORTFOLIO Investm
- Page 309 and 310:
value for a variety of reasons, inc
- Page 311 and 312:
FINANCIAL INTERMEDIARY COMPENSATION
- Page 313 and 314:
(liquidity risk); and the risk that
- Page 315 and 316:
Investment Managers Subadvisers Por
- Page 317 and 318:
Growth style risk. There is a risk
- Page 319 and 320:
SUMMARY: AST T. ROWE PRICE NATURAL
- Page 321 and 322:
Annual Total Returns 60% 40% 33.52
- Page 323 and 324:
Market and management risk. Markets
- Page 325 and 326:
Index Blended Index (reflects no de
- Page 327 and 328:
Fixed income securities risk. Inves
- Page 329 and 330:
Investment Managers Subadviser Port
- Page 331 and 332:
PRINCIPAL RISKS Principal Risks of
- Page 333 and 334:
weighted average maturities general
- Page 335 and 336:
Liquidity and Valuation Risk Of Pri
- Page 337 and 338:
Short Sale Risk. A Portfolio that s
- Page 339 and 340:
Traditional Asset Classes Internati
- Page 341 and 342:
Underlying Fund Portfolio Principal
- Page 343 and 344:
PIMCO may invest all of the assets
- Page 345 and 346:
Convertible Securities are a substa
- Page 347 and 348:
Exposure to some or all of the rema
- Page 349 and 350:
Description of Traditional Investme
- Page 351 and 352:
Under normal circumstances, PIMCO i
- Page 353 and 354:
maturity to process and audit loss
- Page 355 and 356:
The risks of an investment in a CDO
- Page 357 and 358:
BlackRock may use derivatives, incl
- Page 359 and 360:
Up to 10% of the assets attributabl
- Page 361 and 362:
Investment Strategy Minimum Exposur
- Page 363 and 364:
AST Bond Portfolio 2023 Investment
- Page 365 and 366:
some of which may be adjustable rat
- Page 367 and 368:
AST COHEN & STEERS REALTY PORTFOLIO
- Page 369 and 370:
market capitalization (i.e., increa
- Page 371 and 372:
Strategy Large Cap Core 130/30 Stra
- Page 373 and 374:
The approximate allocations above d
- Page 375 and 376:
This investment strategy looks for
- Page 377 and 378:
U.S. Treasury Securities. U.S. Trea
- Page 379 and 380:
VLPI MAKES NO WARRANTY CONCERNING T
- Page 381 and 382:
(sometimes called “junk bonds”)
- Page 383 and 384:
sale of a futures contract will all
- Page 385 and 386:
focuses on valuation relative to a
- Page 387 and 388:
The Portfolio pursues its objective
- Page 389 and 390:
The Portfolio may invest in all typ
- Page 391 and 392:
Under a bank loan assignment, the P
- Page 393 and 394:
Principal Investment Policies: The
- Page 395 and 396:
Other Investments: The Portfolio ma
- Page 397 and 398:
In addition to options and financia
- Page 399 and 400:
Jennison will consider other factor
- Page 401 and 402:
The Portfolio may invest in a wide
- Page 403 and 404:
On or about January 31, 2012, Hotch
- Page 405 and 406:
the Portfolio’s positions against
- Page 407 and 408:
EARNEST expects to focus primarily
- Page 409 and 410:
Demand Features. The Portfolio may
- Page 411 and 412:
AST NEUBERGER BERMAN / LSV MID-CAP
- Page 413 and 414:
morethan7%oftheassets attributable
- Page 415 and 416:
Anticipated Asset Allocation Ranges
- Page 417 and 418:
AST PIMCO LIMITED MATURITY BOND POR
- Page 419 and 420:
esult of a short sale if the price
- Page 421 and 422:
Generally, over the long term, the
- Page 423 and 424:
in rates of return) earned or reali
- Page 425 and 426:
futures that are contractually requ
- Page 427 and 428:
geographic focus (i.e., increase or
- Page 429 and 430:
AST SCHRODERS GLOBAL TACTICAL PORTF
- Page 431 and 432:
This segment of the Portfolio may e
- Page 433 and 434:
they believe are undervalued or oth
- Page 435 and 436:
Futures, Options and Other Derivati
- Page 437 and 438:
As a fund that invests both in equi
- Page 439 and 440:
Debt Instruments and Junk Bonds. Un
- Page 441 and 442:
total Portfolio performance. For ex
- Page 443 and 444:
natural resource companies may be i
- Page 445 and 446:
(iii) “off-benchmark” investmen
- Page 447 and 448:
(ii) the Portfolio sells the index
- Page 449 and 450:
MORE DETAILED INFORMATION ABOUT OTH
- Page 451 and 452:
Loans and Assignments—Loans are p
- Page 453 and 454:
HOW THE FUND IS MANAGED BOARD OF TR
- Page 455 and 456:
AST Neuberger Berman / LSV Mid-Cap
- Page 457 and 458:
INVESTMENT SUBADVISERS The Portfoli
- Page 459 and 460:
Franklin Mutual Advisers, LLC (Fran
- Page 461 and 462:
Security Investors, LLC (SGI) has b
- Page 463 and 464:
Joel M. Kallman, CFA, is a Senior A
- Page 465 and 466:
AQR Capital Management, LLC and CNH
- Page 467 and 468: Mr. Dialynas is a managing director
- Page 469 and 470: Martin Cohen, co-chairman and co-CE
- Page 471 and 472: Mr. Lindquist rejoined First Trust
- Page 473 and 474: Lisa F. Myers, J.D., CFA, joined th
- Page 475 and 476: Sean is Co-CIO and portfolio manage
- Page 477 and 478: James P. Shanahan, Jr., managing di
- Page 479 and 480: AST International Value Portfolio L
- Page 481 and 482: Mr. Peters, Portfolio Manager, join
- Page 483 and 484: Thomas A. Sontag: Managing Director
- Page 485 and 486: Prior to his current position as Po
- Page 487 and 488: Brian Ahrens, CFA is a portfolio ma
- Page 489 and 490: Devang Gambhirwala is a Principal a
- Page 491 and 492: Investment Committee. Prior to join
- Page 493 and 494: Michael J. Conelius, CFA, is a Vice
- Page 495 and 496: HOW TO BUY AND SELL SHARES OF THE P
- Page 497 and 498: NET ASSET VALUE Any purchase or sal
- Page 499 and 500: Appraised values do not necessarily
- Page 501 and 502: The amounts paid depend on the natu
- Page 503 and 504: AST ADVANCED STRATEGIES PORTFOLIO Y
- Page 505 and 506: AST BLACKROCK GLOBAL STRATEGIES POR
- Page 507 and 508: AST BOND PORTFOLIO 2015 January 28,
- Page 509 and 510: AST BOND PORTFOLIO 2017 Year Ended
- Page 511 and 512: AST BOND PORTFOLIO 2019 January 28,
- Page 513 and 514: AST BOND PORTFOLIO 2021 Year Ended
- Page 515 and 516: AST CAPITAL GROWTH ASSET ALLOCATION
- Page 517: AST COHEN & STEERS REALTY PORTFOLIO
- Page 521 and 522: AST FIRST TRUST CAPITAL APPRECIATIO
- Page 523 and 524: AST GOLDMAN SACHS CONCENTRATED GROW
- Page 525 and 526: AST GOLDMAN SACHS MID-CAP GROWTH PO
- Page 527 and 528: AST HIGH YIELD PORTFOLIO Year Ended
- Page 529 and 530: AST HORIZON MODERATE ASSET ALLOCATI
- Page 531 and 532: AST INTERNATIONAL VALUE PORTFOLIO Y
- Page 533 and 534: AST JENNISON LARGE-CAP GROWTH PORTF
- Page 535 and 536: AST JPMORGAN INTERNATIONAL EQUITY P
- Page 537 and 538: AST LARGE-CAP VALUE PORTFOLIO Year
- Page 539 and 540: AST MARSICO CAPITAL GROWTH PORTFOLI
- Page 541 and 542: AST MFS GROWTH PORTFOLIO Year Ended
- Page 543 and 544: AST MONEY MARKET PORTFOLIO Year End
- Page 545 and 546: AST NEUBERGER BERMAN MID-CAP GROWTH
- Page 547 and 548: AST PARAMETRIC EMERGING MARKETS EQU
- Page 549 and 550: AST PIMCO TOTAL RETURN BOND PORTFOL
- Page 551 and 552: AST PRUDENTIAL CORE BOND PORTFOLIO
- Page 553 and 554: AST QUANTITATIVE MODELING PORTFOLIO
- Page 555 and 556: AST SCHRODERS MULTI-ASSET WORLD STR
- Page 557 and 558: AST SMALL-CAP VALUE PORTFOLIO Year
- Page 559 and 560: AST T. ROWE PRICE EQUITY INCOME POR
- Page 561 and 562: AST T. ROWE PRICE LARGE-CAP GROWTH
- Page 563 and 564: AST WELLINGTON MANAGEMENT HEDGED EQ
- Page 565 and 566: APPENDIX ASSET ALLOCATIONS FOR HORI
- Page 567 and 568: AST Horizon Growth Asset Allocation
- Page 569 and 570:
GLOSSARY: PORTFOLIO INDEXES BofA Me
- Page 571 and 572:
Russell 2000 Index. The Russell 200
- Page 573 and 574:
AST Schroders Global Tactical Portf
- Page 575 and 576:
This page intentionally left blank
- Page 577 and 578:
This page intentionally left blank
- Page 579 and 580:
This page intentionally left blank
- Page 581 and 582:
This page intentionally left blank
- Page 583 and 584:
This page intentionally left blank
- Page 585:
The Prudential Insurance Company of