download the full article here - EISRJC
download the full article here - EISRJC
download the full article here - EISRJC

You also want an ePaper? Increase the reach of your titles
YUMPU automatically turns print PDFs into web optimized ePapers that Google loves.
amount of waste for compost and <strong>the</strong> rate of<br />
how this waste were converted. The stock of<br />
solid waste collected was linked to <strong>the</strong> disposed<br />
rate using information on <strong>the</strong> rate of collection<br />
and disposal. The stock of unmanaged waste<br />
was linked to <strong>the</strong> stock of littered waste using<br />
information on <strong>the</strong> volume of uncollected solid<br />
waste and burning rate.<br />
The valve controls <strong>the</strong> flow of waste<br />
getting in and out of <strong>the</strong> stocks as affected by<br />
<strong>the</strong> auxiliary variables. The accumulation or<br />
reduction of <strong>the</strong> stock of waste is dependent on<br />
<strong>the</strong> auxiliary variables.<br />
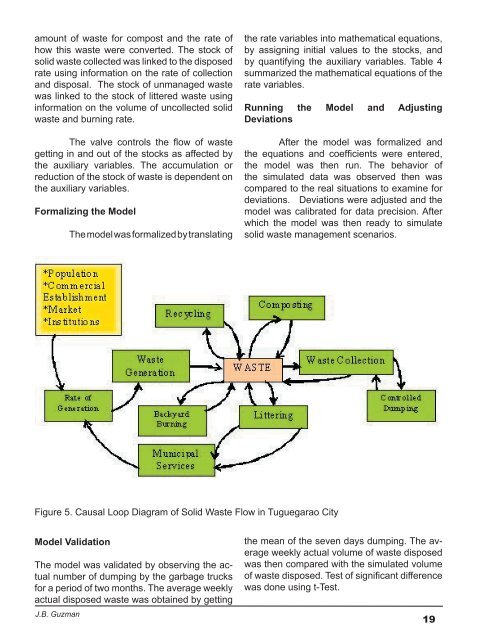
Formalizing <strong>the</strong> Model<br />
The model was formalized by translating<br />
<strong>the</strong> rate variables into ma<strong>the</strong>matical equations,<br />
by assigning initial values to <strong>the</strong> stocks, and<br />
by quantifying <strong>the</strong> auxiliary variables. Table 4<br />
summarized <strong>the</strong> ma<strong>the</strong>matical equations of <strong>the</strong><br />
rate variables.<br />
Running <strong>the</strong> Model and Adjusting<br />
Deviations<br />
After <strong>the</strong> model was formalized and<br />
<strong>the</strong> equations and coefficients were entered,<br />
<strong>the</strong> model was <strong>the</strong>n run. The behavior of<br />
<strong>the</strong> simulated data was observed <strong>the</strong>n was<br />
compared to <strong>the</strong> real situations to examine for<br />
deviations. Deviations were adjusted and <strong>the</strong><br />
model was calibrated for data precision. After<br />
which <strong>the</strong> model was <strong>the</strong>n ready to simulate<br />
solid waste management scenarios.<br />
Figure 5. Causal Loop Diagram of Solid Waste Flow in Tuguegarao City<br />
Model Validation<br />
The model was validated by observing <strong>the</strong> actual<br />
number of dumping by <strong>the</strong> garbage trucks<br />
for a period of two months. The average weekly<br />
actual disposed waste was obtained by getting<br />
J.B. Guzman<br />
<strong>the</strong> mean of <strong>the</strong> seven days dumping. The average<br />
weekly actual volume of waste disposed<br />
was <strong>the</strong>n compared with <strong>the</strong> simulated volume<br />
of waste disposed. Test of significant difference<br />
was done using t-Test.<br />
19