download the full article here - EISRJC
download the full article here - EISRJC
download the full article here - EISRJC

You also want an ePaper? Increase the reach of your titles
YUMPU automatically turns print PDFs into web optimized ePapers that Google loves.
Scenario Building<br />
The scenarios described were;<br />
Scenario A which is <strong>the</strong> composting of market<br />
compostable waste, Scenario B which is <strong>the</strong><br />
recycling of institutional waste, and Scenario C<br />
which is <strong>the</strong> composting and recycling of waste<br />
in all sectors.<br />
In <strong>the</strong> 3 scenarios, household waste<br />
was assumed to increase at an average<br />
annual rate of 1.02% (same as population<br />
growth rate), while <strong>the</strong> waste from commercial<br />
establishments, institutions and <strong>the</strong> market<br />
were assumed to increase at an average<br />
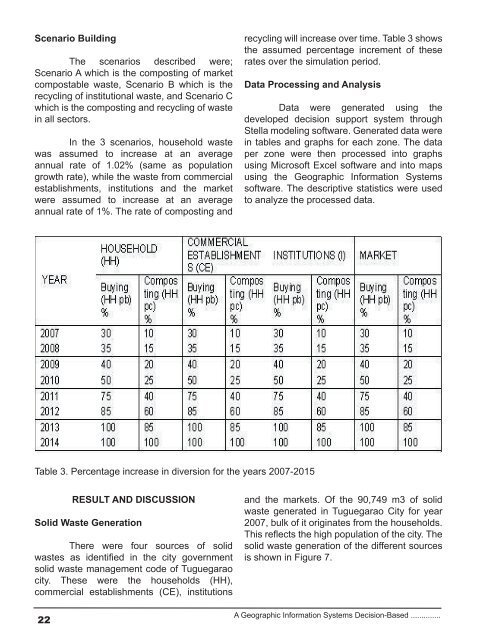
annual rate of 1%. The rate of composting and<br />
recycling will increase over time. Table 3 shows<br />
<strong>the</strong> assumed percentage increment of <strong>the</strong>se<br />
rates over <strong>the</strong> simulation period.<br />
Data Processing and Analysis<br />
Data were generated using <strong>the</strong><br />
developed decision support system through<br />
Stella modeling software. Generated data were<br />
in tables and graphs for each zone. The data<br />
per zone were <strong>the</strong>n processed into graphs<br />
using Microsoft Excel software and into maps<br />
using <strong>the</strong> Geographic Information Systems<br />
software. The descriptive statistics were used<br />
to analyze <strong>the</strong> processed data.<br />
Table 3. Percentage increase in diversion for <strong>the</strong> years 2007-2015<br />
RESULT AND DISCUSSION<br />
Solid Waste Generation<br />
T<strong>here</strong> were four sources of solid<br />
wastes as identified in <strong>the</strong> city government<br />
solid waste management code of Tuguegarao<br />
city. These were <strong>the</strong> households (HH),<br />
commercial establishments (CE), institutions<br />
and <strong>the</strong> markets. Of <strong>the</strong> 90,749 m3 of solid<br />
waste generated in Tuguegarao City for year<br />
2007, bulk of it originates from <strong>the</strong> households.<br />
This reflects <strong>the</strong> high population of <strong>the</strong> city. The<br />
solid waste generation of <strong>the</strong> different sources<br />
is shown in Figure 7.<br />
22<br />
A Geographic Information Systems Decision-Based ..............