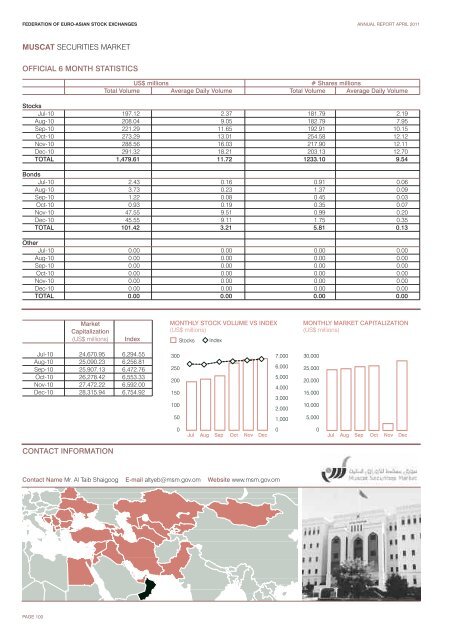
FEDERATION OF EURO-ASIAN STOCK EXCHANGES ANNUAL REPORT APRIL 2011 MUSCAT SECURITIES MARKET OFFICIAL 6 MONTH STATISTICS US$ millions # Shares millions Total Volume Average Daily Volume Total Volume Average Daily Volume Stocks Jul-10 197.12 2.37 181.79 2.19 Aug-10 208.04 9.05 182.79 7.95 Sep-10 221.29 11.65 192.91 10.15 Oct-10 273.29 13.01 254.58 12.12 Nov-10 288.56 16.03 217.90 12.11 Dec-10 291.32 18.21 203.13 12.70 TOTAL 1,479.61 11.72 1233.10 9.54 Bonds Jul-10 2.43 0.16 0.91 0.06 Aug-10 3.73 0.23 1.37 0.09 Sep-10 1.22 0.08 0.45 0.03 Oct-10 0.93 0.19 0.35 0.07 Nov-10 47.55 9.51 0.99 0.20 Dec-10 45.55 9.11 1.75 0.35 TOTAL 101.42 3.21 5.81 0.13 Other Jul-10 0.00 0.00 0.00 0.00 Aug-10 0.00 0.00 0.00 0.00 Sep-10 0.00 0.00 0.00 0.00 Oct-10 0.00 0.00 0.00 0.00 Nov-10 0.00 0.00 0.00 0.00 Dec-10 0.00 0.00 0.00 0.00 TOTAL 0.00 0.00 0.00 0.00 Market Capitalization (US$ millions) Index MONTHLY STOCK VOLUME VS INDEX (US$ millions) Stocks Index MONTHLY MARKET CAPITALIZATION (US$ millions) Jul-10 24,670.95 6,294.55 Aug-10 25,090.23 6,256.81 Sep-10 25,907.13 6,472.76 Oct-10 26,278.42 6,553.33 Nov-10 27,472.22 6,592.00 Dec-10 28,315.94 6,754.92 CONTACT INFORMATION 300 250 200 150 100 50 0 7,000 30,000 6,000 25,000 5,000 20,000 4,000 15,000 3,000 2,000 10,000 1,000 5,000 0 0 Jul Aug Sep Oct Nov Dec Jul Aug Sep Oct Nov Dec Contact Name Mr. Al Taib Shaigoog E-mail altyeb@msm.gov.om Website www.msm.gov.om PAGE 100
FEDERATION OF EURO-ASIAN STOCK EXCHANGES ANNUAL REPORT APRIL 2011 MUSCAT SECURITIES MARKET ECONOMIC AND POLITICAL DEVELOPMENTS The Omani economy continued to drive growth and development to add new block to the blocks of economic development, thanks to prudent financial and economic policies implemented by the Sultanate under its fiveyear plans, which have proven their ability to cause distinctive shift in Oman's economy. This growth was enhanced by the production volume of oil and its prices in 2010, as the production of Oman rose by 6.6% during the year with an average daily production of 862.7 thousand barrels per day compared with 809.6 thousand barrels per day during 2009. Likewise, the average oil price per barrel in 2010 increased by 31.06% to $72.28 compared with $55.15 during 2009. At the end of 2010 the eighth five-year plan was adopted, Episode IV of the long-term development strategy (Oman vision 2020), which aims to continue the investment balance, sustainable growth, human development and economic diversification. This plan aims to enhance growth opportunities through achieving growth rates not less than annual 3% at fixed prices during the plan period and pursue low inflation rates not exceeding 4% annually. During the plan period Oman's economy is expected to record a growth rate in GDP estimated at annual rate of 6% at current prices and 5% at fixed prices. The plan also includes investments worth (77.20) billion Dollars, an increase of 113% from planned in the seventh five-year plan indicating a promising Oman's economy in the coming period. The Omani economy Outlook in 2011, with the expectation of stable and upward tendency of oil prices, as well as with the economic and financial policies supporting national economic stability and growth, the Sultanate has raised expenditure over 2011 to( 21.12)billion Dollars versus (18.65) billion Dollars in 2009, an increase of 13.2%. Revenues expected from budget 2011 are estimated at (18.65) billion Dollars compared with (16.57) billion Dollars in 2009, an increase of 2.1 billion Dollars or 14%. Revenues from both oil and gas account for 81% of total income while current and capital revenues account for 19%. The expected revenues in 2011are based on an average price per barrel of $58. This means the expected deficit in the budget of the year will amount to $(2.20) billion. Although the deficit is relatively high in absolute value, but as a percentage of GDP is safe and within economically acceptable boundaries, and it is believed that this will be covered during the year from actual revenue of projected oil prices because current oil prices are higher than the prices on which the expected revenues were based. In case the revenues are less than expected the deficit would be covered from the general state reserves. As for Muscat Securities Market, it is worth mentioning that trading volume reached US$3421.6 million in 2010 compared with US$5931.8 million in 2009, thus decrease of 42.3%. Meanwhile, the MSM price index increase from 6368.80 points at the end of 2009 to the level of 6754.92 points at the end of 2010, registering an increase of 6.06%. The MSM witnessed traded volume of 3013.17 million shares during the year 2010 recording a decrease of 50.34% compared with 6091 million traded shares as on 2009. During the year 2010 the value of the traded shares was US$ 3421.6 million with a decrease of 43.27% compared with US$ 5380 million during the year 2009. The Market capitalization increased in 2010 recording US$ 28.3 billion compared with US$23.6 billion during 2009. The MSM index rose from 6368 points, during 2009, recording 6754.92 points in 2010 with an increase of 6.06%. During 2010, the Muscat Securities Market scored the third grade from among the GCC exchanges.* Information obtained from the Exchange. OMAN ECONOMIC CHARTS AND TABLES Market Value No of Shares No of Bonds Trading Value No. of (Capitalization) Period MSM index Traded (millions) Traded (millions) $ (millions) Transactions $ (millions) 2005 2006 2007 2008 2009 2010 1989 -- 6 - 24.7 3,459 982.2 1990 -- 25.3 - 122.1 13,230 1,271.8 1991 1,191.8 25.4) - 153.2 13,940 1,503.9 1992 1,130.1 17.9 0.065 109.3 8,313 1,514.1 1993 1,137.1 34.4 0.819 216.9 7,246 1,605.0 1994 1,461.6 60.8 0.144 327.8 14,848 3,006.9 1995 1,581.3 55.7 0.057 283.3 26,203 3,416.5 1996 1,993.6 128.3 0.759 695.2 51,070 4,212.5 1997 4,805.8 410 0.105 4,195.9 161,597 8,670.4 1998 2,284.7 284 0.329 2,376.3 145,004 5,883.7 1999 2,502.6 122.7 0.795 504.6 125,609 5,874.6 2000 2,012.0 146.1 0.070 558.4 76,654 5,058.6 2001 1,520.8 127.9 10.4 451.4 61,882 4,471.7 2002 1,918.6 191.8 10.9 600.7 98,655 5,152.4 2003 2,726.71 315.2 14.2 1,539.6 189,423 7,245.6 2004 3,375.05 347.3 6.6 1,986.3 255,975 9,433.7 2005 4,875.11 508.1 3.1 3,622.9 393,649 15,267.1 2006 5,581.57 1,112.8 2.5 3,482.7 320,103 16,156.1 2007 9,035.48 3,422.2 1.4 6,913.5 570,768 26,679.7 2008 5,441.12 4,440.8 6.3 9,507.9 887,535 20,549.3 2009 6,368.80 6,067.6 23.8 5,931.8 1,049,899 23,613.1 2010 6,754.92 3,013.2 11.3 3,421.6 538,560 28,312.6 Key Information Contacts Ministry of National Economy www.moneoman.gov.om Capital Market Authority www.cma-oman.gov.om Oman Chamber of Commerce and Industry www.cbo-oman.org Financial Corporation www.fincorp.org National Bank of Oman www.nbo.co.om PAGE 101