

Download - FEAS
Download - FEAS
Download - FEAS

You also want an ePaper? Increase the reach of your titles
YUMPU automatically turns print PDFs into web optimized ePapers that Google loves.
FEDERATION OF EURO-ASIAN STOCK EXCHANGES ANNUAL REPORT APRIL 2011<br />
PALESTINE EXCHANGE<br />
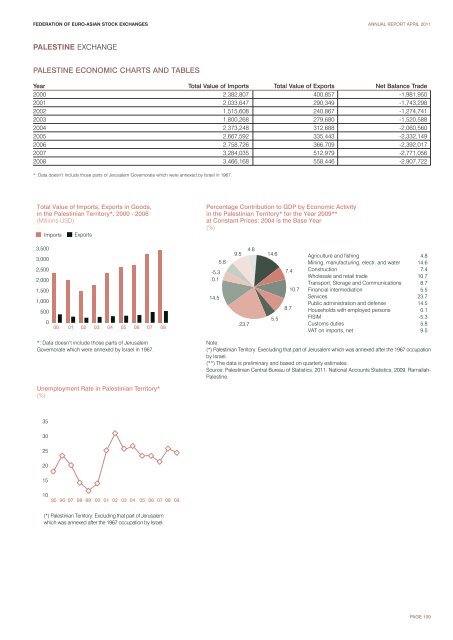
PALESTINE ECONOMIC CHARTS AND TABLES<br />
Year Total Value of Imports Total Value of Exports Net Balance Trade<br />
2000 2,382,807 400,857 -1,981,950<br />
2001 2,033,647 290,349 -1,743,298<br />
2002 1,515,608 240,867 -1,274,741<br />
2003 1,800,268 279,680 -1,520,588<br />
2004 2,373,248 312,688 -2,060,560<br />
2005 2,667,592 335,443 -2,332,149<br />
2006 2,758,726 366,709 -2,392,017<br />
2007 3,284,035 512,979 -2,771,056<br />
2008 3,466,168 558,446 -2,907,722<br />
*: Data doesn’t include those parts of Jerusalem Governorate which were annexed by Israel in 1967.<br />
Total Value of Imports, Exports in Goods,<br />
in the Palestinian Territory*, 2000 - 2008<br />
(Millions USD)<br />
Imports<br />
Exports<br />
Percentage Contribution to GDP by Economic Activity<br />
in the Palestinian Territory* for the Year 2009**<br />
at Constant Prices: 2004 is the Base Year<br />
(%)<br />
3,500<br />
3,000<br />
2,500<br />
2,000<br />
1,500<br />
1,000<br />
500<br />
0<br />
00 01 02 03 04 05 06 07 08<br />
5.8<br />
-5.3<br />
0.1<br />
14.5<br />
9.5<br />
23.7<br />
4.8<br />
14.6<br />
5.5<br />
7.4<br />
8.7<br />
10.7<br />
Agriculture and fishing 4.8<br />
Mining, manufacturing, electr. and water 14.6<br />
Construction 7.4<br />
Wholesale and retail trade 10.7<br />
Transport, Storage and Communications 8.7<br />
Financial intermediation 5.5<br />
Services 23.7<br />
Public administration and defense 14.5<br />
Households with employed persons 0.1<br />
FISIM -5.3<br />
Customs duties 5.8<br />
VAT on imports, net 9.5<br />
*: Data doesn’t include those parts of Jerusalem<br />
Governorate which were annexed by Israel in 1967.<br />
Note:<br />
(*) Palestinian Territory: Execluding that part of Jerusalem which was annexed after the 1967 occupation<br />
by Israel.<br />
(**) The data is preliminary and based on quarterly estimates.<br />
Source: Palestinian Central Bureau of Statistics, 2011. National Accounts Statistics, 2009. Ramallah-<br />
Palestine.<br />
Unemployment Rate in Palestinian Territory*<br />
(%)<br />
35<br />
30<br />
25<br />
20<br />
15<br />
10<br />
95 96 97 98 99 00 01 02 03 04 05 06 07 08 09<br />
(*) Palestinian Territory: Excluding that part of Jerusalem<br />
which was annexed after the 1967 occupation by Israel.<br />
PAGE 109


