

Download - FEAS
Download - FEAS
Download - FEAS

You also want an ePaper? Increase the reach of your titles
YUMPU automatically turns print PDFs into web optimized ePapers that Google loves.
FEDERATION OF EURO-ASIAN STOCK EXCHANGES ANNUAL REPORT APRIL 2011<br />
EGYPTIAN EXCHANGE<br />
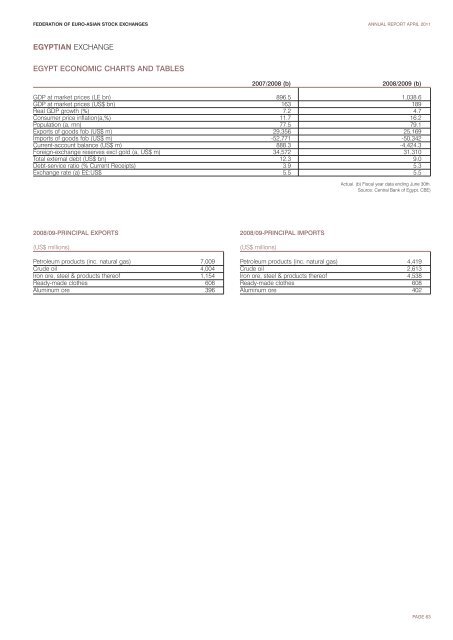
EGYPT ECONOMIC CHARTS AND TABLES<br />
2007/2008 (b) 2008/2009 (b)<br />
GDP at market prices (LE bn) 896.5 1,038.6<br />
GDP at market prices (US$ bn) 163 189<br />
Real GDP growth (%) 7.2 4.7<br />
Consumer price inflation(a,%) 11.7 16.2<br />
Population (a, mn) 77.5 79.1<br />
Exports of goods fob (US$ m) 29,356 25,169<br />
Imports of goods fob (US$ m) -52,771 -50,342<br />
Current-account balance (US$ m) 888.3 -4,424.3<br />
Foreign-exchange reserves excl gold (a, US$ m) 34,572 31,310<br />
Total external debt (US$ bn) 12.3 9.0<br />
Debt-service ratio (% Current Receipts) 3.9 5.3<br />
Exchange rate (a) E£:US$ 5.5 5.5<br />
Actual. (b) Fiscal year data ending June 30th.<br />
Source: Central Bank of Egypt, CBE)<br />
2008/09-PRINCIPAL EXPORTS<br />
(US$ millions)<br />
Petroleum products (inc. natural gas) 7,009<br />
Crude oil 4,004<br />
Iron ore, steel & products thereof 1,154<br />
Ready-made clothes 608<br />
Aluminum ore 396<br />
2008/09-PRINCIPAL IMPORTS<br />
(US$ millions)<br />
Petroleum products (inc. natural gas) 4,419<br />
Crude oil 2,613<br />
Iron ore, steel & products thereof 4,538<br />
Ready-made clothes 608<br />
Aluminum ore 402<br />
PAGE 63


