

Download - FEAS
Download - FEAS
Download - FEAS

You also want an ePaper? Increase the reach of your titles
YUMPU automatically turns print PDFs into web optimized ePapers that Google loves.
FEDERATION OF EURO-ASIAN STOCK EXCHANGES ANNUAL REPORT APRIL 2011<br />
MUSCAT SECURITIES MARKET<br />
ECONOMIC AND POLITICAL DEVELOPMENTS<br />
The Omani economy continued to drive<br />
growth and development to add new block to<br />
the blocks of economic development, thanks<br />
to prudent financial and economic policies<br />
implemented by the Sultanate under its fiveyear<br />
plans, which have proven their ability to<br />
cause distinctive shift in Oman's economy.<br />
This growth was enhanced by the production<br />
volume of oil and its prices in 2010, as the<br />
production of Oman rose by 6.6% during the<br />
year with an average daily production of 862.7<br />
thousand barrels per day compared with 809.6<br />
thousand barrels per day during 2009.<br />
Likewise, the average oil price per barrel in<br />
2010 increased by 31.06% to $72.28<br />
compared with $55.15 during 2009.<br />
At the end of 2010 the eighth five-year plan<br />
was adopted, Episode IV of the long-term<br />
development strategy (Oman vision 2020),<br />
which aims to continue the investment<br />
balance, sustainable growth, human<br />
development and economic diversification.<br />
This plan aims to enhance growth<br />
opportunities through achieving growth rates<br />
not less than annual 3% at fixed prices during<br />
the plan period and pursue low inflation rates<br />
not exceeding 4% annually. During the plan<br />
period Oman's economy is expected to record<br />
a growth rate in GDP estimated at annual rate<br />
of 6% at current prices and 5% at fixed prices.<br />
The plan also includes investments worth<br />
(77.20) billion Dollars, an increase of 113%<br />
from planned in the seventh five-year plan<br />
indicating a promising Oman's economy in the<br />
coming period.<br />
The Omani economy Outlook in 2011, with the<br />
expectation of stable and upward tendency of<br />
oil prices, as well as with the economic and<br />
financial policies supporting national economic<br />
stability and growth, the Sultanate has raised<br />
expenditure over 2011 to( 21.12)billion Dollars<br />
versus (18.65) billion Dollars in 2009, an<br />
increase of 13.2%. Revenues expected from<br />
budget 2011 are estimated at (18.65) billion<br />
Dollars compared with (16.57) billion Dollars in<br />
2009, an increase of 2.1 billion Dollars or 14%.<br />
Revenues from both oil and gas account for<br />
81% of total income while current and capital<br />
revenues account for 19%. The expected<br />
revenues in 2011are based on an average<br />
price per barrel of $58. This means the<br />
expected deficit in the budget of the year will<br />
amount to $(2.20) billion. Although the deficit<br />
is relatively high in absolute value, but as a<br />
percentage of GDP is safe and within<br />
economically acceptable boundaries, and it is<br />
believed that this will be covered during the<br />
year from actual revenue of projected oil<br />
prices because current oil prices are higher<br />
than the prices on which the expected<br />
revenues were based. In case the revenues<br />
are less than expected the deficit would be<br />
covered from the general state reserves.<br />
As for Muscat Securities Market, it is worth<br />
mentioning that trading volume reached<br />
US$3421.6 million in 2010 compared with<br />
US$5931.8 million in 2009, thus decrease of<br />
42.3%. Meanwhile, the MSM price index<br />
increase from 6368.80 points at the end of<br />
2009 to the level of 6754.92 points at the end<br />
of 2010, registering an increase of 6.06%.<br />
The MSM witnessed traded volume of 3013.17<br />
million shares during the year 2010 recording<br />
a decrease of 50.34% compared with 6091<br />
million traded shares as on 2009. During the<br />
year 2010 the value of the traded shares was<br />
US$ 3421.6 million with a decrease of 43.27%<br />
compared with US$ 5380 million during the<br />
year 2009. The Market capitalization increased<br />
in 2010 recording US$ 28.3 billion compared<br />
with US$23.6 billion during 2009.<br />
The MSM index rose from 6368 points, during<br />
2009, recording 6754.92 points in 2010 with an<br />
increase of 6.06%. During 2010, the Muscat<br />
Securities Market scored the third grade from<br />
among the GCC exchanges.*<br />
Information obtained from the Exchange.<br />
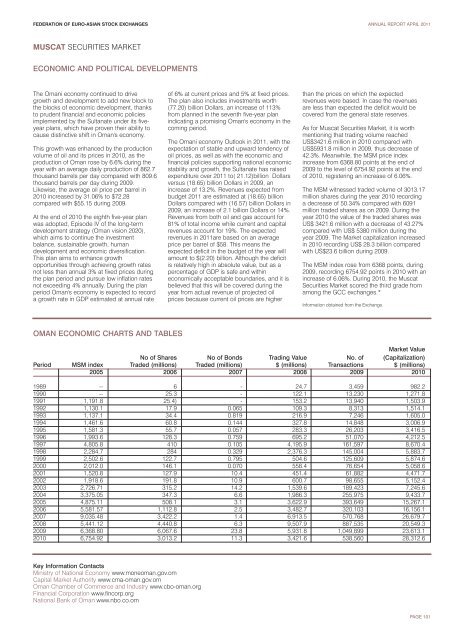
OMAN ECONOMIC CHARTS AND TABLES<br />
Market Value<br />
No of Shares No of Bonds Trading Value No. of (Capitalization)<br />
Period MSM index Traded (millions) Traded (millions) $ (millions) Transactions $ (millions)<br />
2005 2006 2007 2008 2009 2010<br />
1989 -- 6 - 24.7 3,459 982.2<br />
1990 -- 25.3 - 122.1 13,230 1,271.8<br />
1991 1,191.8 25.4) - 153.2 13,940 1,503.9<br />
1992 1,130.1 17.9 0.065 109.3 8,313 1,514.1<br />
1993 1,137.1 34.4 0.819 216.9 7,246 1,605.0<br />
1994 1,461.6 60.8 0.144 327.8 14,848 3,006.9<br />
1995 1,581.3 55.7 0.057 283.3 26,203 3,416.5<br />
1996 1,993.6 128.3 0.759 695.2 51,070 4,212.5<br />
1997 4,805.8 410 0.105 4,195.9 161,597 8,670.4<br />
1998 2,284.7 284 0.329 2,376.3 145,004 5,883.7<br />
1999 2,502.6 122.7 0.795 504.6 125,609 5,874.6<br />
2000 2,012.0 146.1 0.070 558.4 76,654 5,058.6<br />
2001 1,520.8 127.9 10.4 451.4 61,882 4,471.7<br />
2002 1,918.6 191.8 10.9 600.7 98,655 5,152.4<br />
2003 2,726.71 315.2 14.2 1,539.6 189,423 7,245.6<br />
2004 3,375.05 347.3 6.6 1,986.3 255,975 9,433.7<br />
2005 4,875.11 508.1 3.1 3,622.9 393,649 15,267.1<br />
2006 5,581.57 1,112.8 2.5 3,482.7 320,103 16,156.1<br />
2007 9,035.48 3,422.2 1.4 6,913.5 570,768 26,679.7<br />
2008 5,441.12 4,440.8 6.3 9,507.9 887,535 20,549.3<br />
2009 6,368.80 6,067.6 23.8 5,931.8 1,049,899 23,613.1<br />
2010 6,754.92 3,013.2 11.3 3,421.6 538,560 28,312.6<br />
Key Information Contacts<br />
Ministry of National Economy www.moneoman.gov.om<br />
Capital Market Authority www.cma-oman.gov.om<br />
Oman Chamber of Commerce and Industry www.cbo-oman.org<br />
Financial Corporation www.fincorp.org<br />
National Bank of Oman www.nbo.co.om<br />
PAGE 101


