Locomotive Emissions Monitoring Program - Railway Association of ...
Locomotive Emissions Monitoring Program - Railway Association of ...
Locomotive Emissions Monitoring Program - Railway Association of ...

Create successful ePaper yourself
Turn your PDF publications into a flip-book with our unique Google optimized e-Paper software.
2.2.2<br />
Commuter Rail<br />
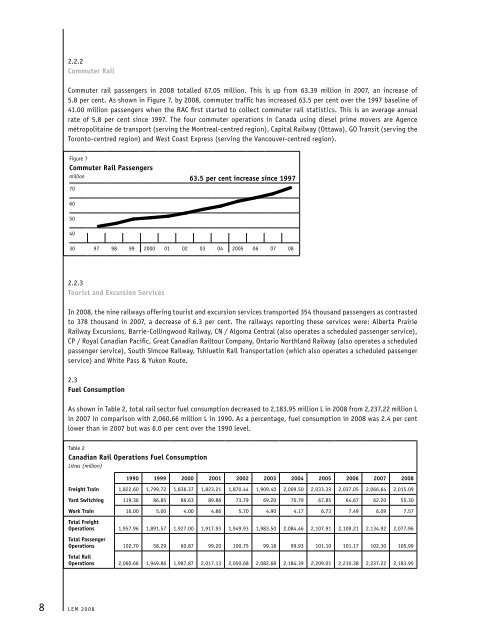
Commuter rail passengers in 2008 totalled 67.05 million. This is up from 63.39 million in 2007, an increase <strong>of</strong><br />
5.8 per cent. As shown in Figure 7, by 2008, commuter traffic has increased 63.5 per cent over the 1997 baseline <strong>of</strong><br />
41.00 million passengers when the RAC first started to collect commuter rail statistics. This is an average annual<br />
rate <strong>of</strong> 5.8 per cent since 1997. The four commuter operations in Canada using diesel prime movers are Agence<br />
métropolitaine de transport (serving the Montreal-centred region), Capital <strong>Railway</strong> (Ottawa), GO Transit (serving the<br />
Toronto-centred region) and West Coast Express (serving the Vancouver-centred region).<br />
Figure 7<br />
Commuter Rail Passengers<br />
million<br />
63.5 per cent increase since 1997<br />
70<br />
70<br />
60<br />
60<br />
50<br />
50<br />
40<br />
40<br />
30<br />
30 97 98 99 2000 01 02 03 04 2005 06 07 08<br />
2.2.3<br />
Tourist and Excursion Services<br />
In 2008, the nine railways <strong>of</strong>fering tourist and excursion services transported 354 thousand passengers as contrasted<br />
to 378 thousand in 2007, a decrease <strong>of</strong> 6.3 per cent. The railways reporting these services were: Alberta Prairie<br />
<strong>Railway</strong> Excursions, Barrie-Collingwood <strong>Railway</strong>, CN / Algoma Central (also operates a scheduled passenger service),<br />
CP / Royal Canadian Pacific, Great Canadian Railtour Company, Ontario Northland <strong>Railway</strong> (also operates a scheduled<br />
passenger service), South Simcoe <strong>Railway</strong>, Tshiuetin Rail Transportation (which also operates a scheduled passenger<br />
service) and White Pass & Yukon Route.<br />
2.3<br />
Fuel Consumption<br />
As shown in Table 2, total rail sector fuel consumption decreased to 2,183.95 million L in 2008 from 2,237.22 million L<br />
in 2007 in comparison with 2,060.66 million L in 1990. As a percentage, fuel consumption in 2008 was 2.4 per cent<br />
lower than in 2007 but was 6.0 per cent over the 1990 level.<br />
Table 2<br />
Canadian Rail Operations Fuel Consumption<br />
Litres (million)<br />
1990 1999 2000 2001 2002 2003 2004 2005 2006 2007 2008<br />
Freight Train 1,822.60 1,799.72 1,836.37 1,823.21 1,870.44 1,909.40 2,009.50 2,033.33 2,037.05 2,066.64 2,015.09<br />
Yard Switching 119.36 86.85 86.63 89.86 73.79 69.20 70.79 67.85 64.67 62.20 55.30<br />
Work Train 16.00 5.00 4.00 4.86 5.70 4.90 4.17 6.73 7.49 6.09 7.57<br />
Total Freight<br />
Operations 1,957.96 1,891.57 1,927.00 1,917.93 1,949.93 1,983.50 2,084.46 2,107.91 2,109.21 2,134.92 2,077.96<br />
Total Passenger<br />
Operations 102.70 58.29 60.87 99.20 100.75 99.18 99.93 101.10 101.17 102.30 105.99<br />
Total Rail<br />
Operations 2,060.66 1,949.86 1,987.87 2,017.13 2,050.68 2,082.68 2,184.39 2,209.01 2,210.38 2,237.22 2,183.95<br />
8 LEM 2008