Locomotive Emissions Monitoring Program - Railway Association of ...
Locomotive Emissions Monitoring Program - Railway Association of ...
Locomotive Emissions Monitoring Program - Railway Association of ...

You also want an ePaper? Increase the reach of your titles
YUMPU automatically turns print PDFs into web optimized ePapers that Google loves.
Figure 15<br />
Commuter Rail GHG <strong>Emissions</strong> Intensity<br />
kg per passenger<br />
2.2<br />
2.0<br />
1.8<br />
1.6<br />
1.4<br />
2.0<br />
1.8<br />
1.6<br />
1.4<br />
CO 2 equivalent<br />
1.2<br />
1.2 2003 2004 2005 2006 2007 2008<br />
5.3.2<br />
Criteria Air Contaminants (CAC)<br />
Table 11 displays the CAC emissions produced annually by locomotives in operation in Canada, namely NOx, CO, HC,<br />
PM and SOx. The values are for both absolute amounts and intensities per productivity unit.<br />
The CAC <strong>of</strong> key concern in the railway sector is oxides <strong>of</strong> nitrogen (NOx). As shown in Table 11, railway-generated<br />
NOx emissions in 2008 totalled 99.68 kt, as compared to 103.18 kt in 2007 and 113.59 kt for 1990, the baseline year.<br />
Total rail NOx emissions in 2008 were 3.4 per cent lower than in 2007 and 12.2 per cent lower than in 1990. Since<br />
1990, NOx emissions have averaged 112.98 kt per year. Freight operations accounted for 93.8 per cent <strong>of</strong> railwaygenerated<br />
NOx emissions in Canada.<br />
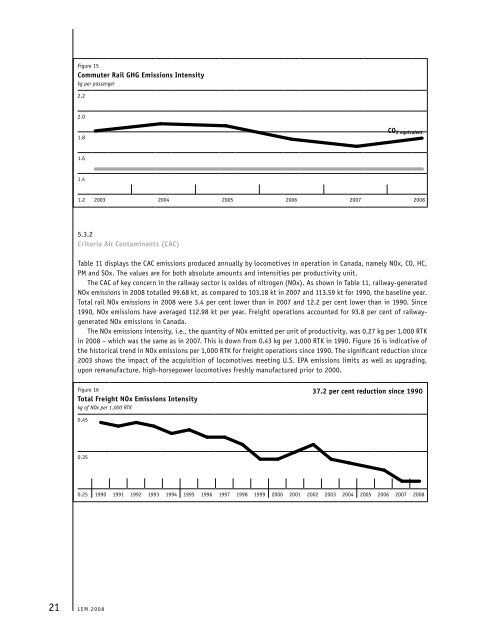
The NOx emissions intensity, i.e., the quantity <strong>of</strong> NOx emitted per unit <strong>of</strong> productivity, was 0.27 kg per 1,000 RTK<br />
in 2008 – which was the same as in 2007. This is down from 0.43 kg per 1,000 RTK in 1990. Figure 16 is indicative <strong>of</strong><br />
the historical trend in NOx emissions per 1,000 RTK for freight operations since 1990. The significant reduction since<br />
2003 shows the impact <strong>of</strong> the acquisition <strong>of</strong> locomotives meeting U.S. EPA emissions limits as well as upgrading,<br />
upon remanufacture, high-horsepower locomotives freshly manufactured prior to 2000.<br />
Figure 16<br />
Total Freight NOx <strong>Emissions</strong> Intensity<br />
kg <strong>of</strong> NOx per 1,000 RTK<br />
37.2 per cent reduction since 1990<br />
0.45<br />
0.35<br />
0.35<br />
0.25<br />
0.25 1990 1991 1992 1993 1994 1995 1996 1997 1998 1999 2000 2001 2002 2003 2004 2005 2006 2007 2008<br />
21 LEM 2008