Locomotive Emissions Monitoring Program - Railway Association of ...
Locomotive Emissions Monitoring Program - Railway Association of ...
Locomotive Emissions Monitoring Program - Railway Association of ...

Create successful ePaper yourself
Turn your PDF publications into a flip-book with our unique Google optimized e-Paper software.
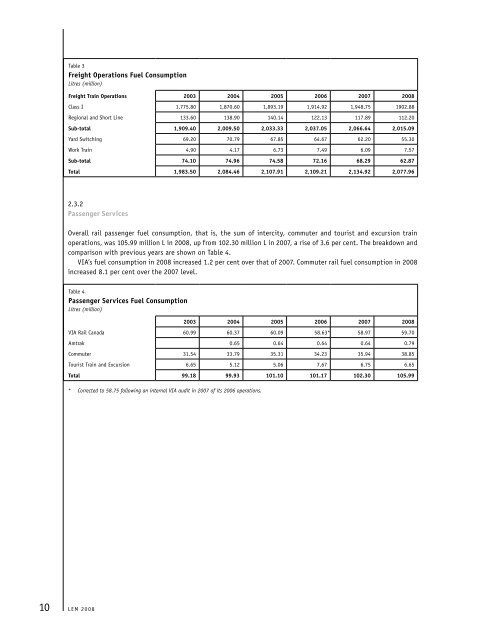
Table 3<br />
Freight Operations Fuel Consumption<br />
Litres (million)<br />
Freight Train Operations 2003 2004 2005 2006 2007 2008<br />
Class I 1,775.80 1,870.60 1,893.19 1,914.92 1,948.75 1902.88<br />
Regional and Short Line 133.60 138.90 140.14 122.13 117.89 112.20<br />
Sub-total 1,909.40 2,009.50 2,033.33 2,037.05 2,066.64 2,015.09<br />
Yard Switching 69.20 70.79 67.85 64.67 62.20 55.30<br />
Work Train 4.90 4.17 6.73 7.49 6.09 7.57<br />
Sub-total 74.10 74.96 74.58 72.16 68.29 62.87<br />
Total 1,983.50 2,084.46 2,107.91 2,109.21 2,134.92 2,077.96<br />
2.3.2<br />
Passenger Services<br />
Overall rail passenger fuel consumption, that is, the sum <strong>of</strong> intercity, commuter and tourist and excursion train<br />
operations, was 105.99 million L in 2008, up from 102.30 million L in 2007, a rise <strong>of</strong> 3.6 per cent. The breakdown and<br />
comparison with previous years are shown on Table 4.<br />
VIA’s fuel consumption in 2008 increased 1.2 per cent over that <strong>of</strong> 2007. Commuter rail fuel consumption in 2008<br />
increased 8.1 per cent over the 2007 level.<br />
Table 4<br />
Passenger Services Fuel Consumption<br />
Litres (million)<br />
2003 2004 2005 2006 2007 2008<br />
VIA Rail Canada 60.99 60.37 60.09 58.63* 58.97 59.70<br />
Amtrak 0.65 0.64 0.64 0.64 0.79<br />
Commuter 31.54 33.79 35.31 34.23 35.94 38.85<br />
Tourist Train and Excursion 6.65 5.12 5.06 7.67 6.75 6.65<br />
Total 99.18 99.93 101.10 101.17 102.30 105.99<br />
* Corrected to 58.75 following an internal VIA audit in 2007 <strong>of</strong> its 2006 operations.<br />
10 LEM 2008