Prime pagine RA2010FUS:Copia di Layout 1 - ENEA - Fusione
Prime pagine RA2010FUS:Copia di Layout 1 - ENEA - Fusione
Prime pagine RA2010FUS:Copia di Layout 1 - ENEA - Fusione

You also want an ePaper? Increase the reach of your titles
YUMPU automatically turns print PDFs into web optimized ePapers that Google loves.
magnetic confinement (cont’d.)<br />
progress report<br />
2010<br />
017<br />
Experimental observation of beta–induced Alfvén Eigenmodes.<br />
FTU activities in 2010 were focused on the observation of long<br />
(>200 ms) beta–induced Alfvén eigenmodes (BAEs), which are<br />
high frequency oscillations (30–70 kHz) in tokamak plasmas,<br />
identified in the spectrum of the Alfvénic modes as <strong>di</strong>screte<br />
eigenmodes located in the low frequency gap of the Alfvén<br />
continuum produced by the geodesic curvature and finite beta<br />
effect. BAEs have been first identified as waves excited by<br />
circulating fast ions, however they were also observed in ohmic<br />
plasmas with the simultaneous presence of large magnetic islands<br />
[1.8]. BAE oscillations from 30 to 50 KHz have been observed in<br />
FTU plasmas with the simultaneous occurrence of tearing modes<br />
(characterized by frequencies from 1 to 5 KHz). BAEs have<br />
intensities two order of magnitude less than tearing modes, and<br />
are characterized by two main lines, which merge in a single line<br />
when the island oscillation frequency becomes very low. Mode<br />
analysis for tearing mode shows that poloidal and toroidal mode<br />
numbers are (m, n)=(–2,–1). On the other side, the higher BAE<br />
frequency is characterized by (m, n)=(–2,–1), i.e., propagates in<br />
the same <strong>di</strong>rection as the island, while the lower BAE frequency<br />
has (m, n)=(2,1), i.e., propagates in the opposite <strong>di</strong>rection. The<br />
<strong>di</strong>fference in frequency of the two BAE lines is exactly twice the<br />
fundamental frequency of the tearing mode, and the frequency<br />
<strong>di</strong>fference can be explained by the doppler shift due to island<br />
rotation.<br />
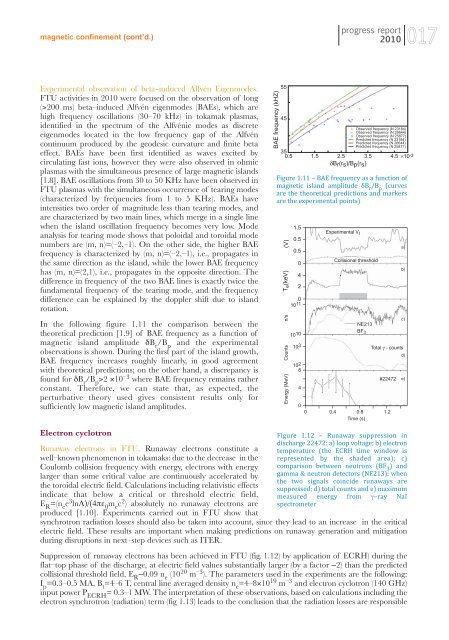
In the following figure 1.11 the comparison between the<br />
theoretical pre<strong>di</strong>ction [1.9] of BAE frequency as a function of<br />
magnetic island amplitude δB r<br />
/B p<br />
and the experimental<br />
observations is shown. During the first part of the island growth,<br />
BAE frequency increases roughly linearly, in good agreement<br />
with theoretical pre<strong>di</strong>ctions; on the other hand, a <strong>di</strong>screpancy is<br />
found for δB r<br />
/B p<br />
>2 ×10 –3 where BAE frequency remains rather<br />
constant. Therefore, we can state that, as expected, the<br />
perturbative theory used gives consistent results only for<br />
sufficiently low magnetic island amplitudes.<br />
BAE frequency (kHZ)<br />
55<br />
45<br />
Observed frequency (N 23184)<br />
Observed frequency (N 26644)<br />
Observed frequency (N 25877)<br />
Pre<strong>di</strong>cted frequency (N 23184)<br />
Pre<strong>di</strong>cted frequency (N 26644)<br />
Pre<strong>di</strong>cted frequency (N 25877)<br />
35<br />
0.5 1.5 2.5 3.5 4.5 ×10 -3<br />
δBr(rs)/Bp(rs)<br />
Figure 1.11 – BAE frequency as a function of<br />
magnetic island amplitude δB r /B p (curves<br />
are the theoretical pre<strong>di</strong>ctions and markers<br />
are the experimental points)<br />
(V)<br />
T e (keV)<br />
n/s<br />
Counts<br />
Energy (MeV)<br />
1.5<br />
0.5<br />
0.5<br />
0<br />
4<br />
2<br />
0<br />
10 11<br />
10 10<br />
10 3<br />
10 2<br />
8<br />
4<br />
Experimental V I<br />
Collisional threshold<br />
NE213<br />
BF 3<br />
a)<br />
b)<br />
c)<br />
Total γ - counts<br />
#22472<br />
0<br />
0 0.4 0.8 1.2<br />
Time (s)<br />
d)<br />
e)<br />
Electron cyclotron<br />
Runaway electrons in FTU. Runaway electrons constitute a<br />
well–known phenomenon in tokamaks: due to the decrease in the<br />
Coulomb collision frequency with energy, electrons with energy<br />
larger than some critical value are continuously accelerated by<br />
the toroidal electric field. Calculations inclu<strong>di</strong>ng relativistic effects<br />
in<strong>di</strong>cate that below a critical or threshold electric field,<br />
E R<br />
=(n e<br />
e 3 lnΛ)/(4πε 0<br />
m e<br />
c 2 ) absolutely no runaway electrons are<br />
produced [1.10]. Experiments carried out in FTU show that<br />
Figure 1.12 – Runaway suppression in<br />
<strong>di</strong>scharge 22472: a) loop voltage; b) electron<br />
temperature (the ECRH time window is<br />
represented by the shaded area); c)<br />
comparison between neutrons (BF 3 ) and<br />
gamma & neutron detectors (NE213): when<br />
the two signals coincide runaways are<br />
suppressed; d) total counts and e) maximum<br />
measured energy from γ–ray NaI<br />
spectrometer<br />
synchrotron ra<strong>di</strong>ation losses should also be taken into account, since they lead to an increase in the critical<br />
electric field. These results are important when making pre<strong>di</strong>ctions on runaway generation and mitigation<br />
during <strong>di</strong>sruptions in next–step devices such as ITER.<br />
Suppression of runaway electrons has been achieved in FTU (fig. 1.12) by application of ECRH) during the<br />
flat–top phase of the <strong>di</strong>scharge, at electric field values substantially larger (by a factor ∼2) than the pre<strong>di</strong>cted<br />
collisional threshold field, E R<br />
∼0.09 n e<br />
(10 20 m –3 ). The parameters used in the experiments are the following:<br />
I p<br />
=0.3–0.5 MA, B t<br />
=4–6 T, central line averaged density n e<br />
=4–8×10 19 m –3 and electron cyclotron (140 GHz)<br />
input power P ECRH<br />
= 0.3–1 MW. The interpretation of these observations, based on calculations inclu<strong>di</strong>ng the<br />
electron synchrotron (ra<strong>di</strong>ation) term (fig 1.13) leads to the conclusion that the ra<strong>di</strong>ation losses are responsible