![Director of Public Health Annual Report 2012 [pdf] - Stoke-on-Trent ...](https://img.yumpu.com/32721490/26/500x640/director-of-public-health-annual-report-2012-pdf-stoke-on-trent-.jpg)
Director of Public Health Annual Report 2012 [pdf] - Stoke-on-Trent ...
Director of Public Health Annual Report 2012 [pdf] - Stoke-on-Trent ...
Director of Public Health Annual Report 2012 [pdf] - Stoke-on-Trent ...

You also want an ePaper? Increase the reach of your titles
YUMPU automatically turns print PDFs into web optimized ePapers that Google loves.
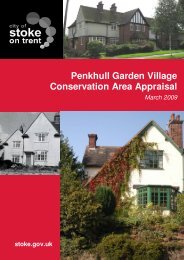
Rate per 1,000 females (aged 15-17)<br />
females aged 15-17) means there were 757 teenage pregnancies compared with 862 in<br />
2007-2009, a fall <str<strong>on</strong>g>of</str<strong>on</strong>g> 105. The current rate in the city is also the lowest it has been since<br />
1997-1999.<br />
Figure 9 Teenage pregnancy rate in <str<strong>on</strong>g>Stoke</str<strong>on</strong>g>-<strong>on</strong>-<strong>Trent</strong> between 1997-1999 and 2008-<br />
2010<br />
80<br />
70<br />
60<br />
50<br />
22.1 24.0<br />
20.9<br />
40<br />
<str<strong>on</strong>g>Stoke</str<strong>on</strong>g><br />
England<br />
30<br />
20<br />
10<br />
0<br />
1997-99 1999-01 2001-03 2003-05 2005-07 2007-09<br />
Year<br />
Source: Office for Nati<strong>on</strong>al Statistics and Department for Educati<strong>on</strong> <str<strong>on</strong>g>2012</str<strong>on</strong>g><br />
Summary <str<strong>on</strong>g>of</str<strong>on</strong>g> health in <str<strong>on</strong>g>Stoke</str<strong>on</strong>g>-<strong>on</strong>-<strong>Trent</strong> wards<br />
Based <strong>on</strong> the mortality and hospital admissi<strong>on</strong>s data (for all causes, cancer, circulatory<br />
disease, and respiratory disease) we have seen how health varies c<strong>on</strong>siderably am<strong>on</strong>g the<br />
37 wards <str<strong>on</strong>g>of</str<strong>on</strong>g> <str<strong>on</strong>g>Stoke</str<strong>on</strong>g>-<strong>on</strong>-<strong>Trent</strong>. To look at this variati<strong>on</strong>, each <str<strong>on</strong>g>of</str<strong>on</strong>g> the wards have been ranked<br />
(based <strong>on</strong> their mortality and admissi<strong>on</strong> rates) from the highest to lowest, and an overall<br />
summary ranking has been produced (table 2).<br />
Based <strong>on</strong> the four health indicators presented, the three ‘most unhealthy’ wards were Fent<strong>on</strong><br />
West and Mount Pleasant, Moorcr<str<strong>on</strong>g>of</str<strong>on</strong>g>t, and Burslem<br />
Central. The ward <str<strong>on</strong>g>of</str<strong>on</strong>g> Fent<strong>on</strong> West and Mount <str<strong>on</strong>g>Health</str<strong>on</strong>g> varies c<strong>on</strong>siderably am<strong>on</strong>g<br />
Pleasant was ranked the unhealthiest in regards the 37 wards <str<strong>on</strong>g>of</str<strong>on</strong>g> <str<strong>on</strong>g>Stoke</str<strong>on</strong>g>-<strong>on</strong>-<strong>Trent</strong><br />
to admissi<strong>on</strong>s to hospital from all causes <str<strong>on</strong>g>of</str<strong>on</strong>g><br />
disease, cancer and circulatory disease. The three<br />
‘most healthy’ wards were Meir Park, Lightwood North and Normacot, and Hanford and<br />
<strong>Trent</strong>ham. The ward <str<strong>on</strong>g>of</str<strong>on</strong>g> Meir Park was ranked the healthiest in regards to mortality from<br />
cancer and circulatory disease. The health rankings <str<strong>on</strong>g>of</str<strong>on</strong>g> all 37 wards in <str<strong>on</strong>g>Stoke</str<strong>on</strong>g>-<strong>on</strong>-<strong>Trent</strong> are<br />
available in Appendix 6 and 7.<br />
24 | P a g e