

Brambles 2006 Annual Report - Alle jaarverslagen
Brambles 2006 Annual Report - Alle jaarverslagen
Brambles 2006 Annual Report - Alle jaarverslagen

Create successful ePaper yourself
Turn your PDF publications into a flip-book with our unique Google optimized e-Paper software.
40<br />
<strong>Brambles</strong><br />
<strong>2006</strong> <strong>Annual</strong> <strong>Report</strong><br />
BVA and Return on Capital Invested<br />
performance<br />
<strong>2006</strong> at<br />
fixed<br />
June 05 fx<br />
US$m ROCI %<br />
2005 at<br />
fixed<br />
June 05 fx<br />
US$m ROCI %<br />
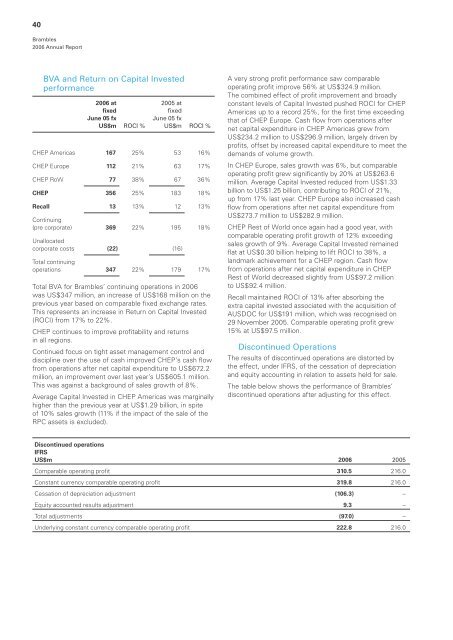
CHEP Americas 167 25% 53 16%<br />
CHEP Europe 112 21% 63 17%<br />
CHEP RoW 77 38% 67 36%<br />
CHEP 356 25% 183 18%<br />
Recall 13 13% 12 13%<br />
Continuing<br />
(pre corporate) 369 22% 195 18%<br />
Unallocated<br />
corporate costs (22) (16)<br />
Total continuing<br />
operations 347 22% 179 17%<br />
Total BVA for <strong>Brambles</strong>’ continuing operations in <strong>2006</strong><br />
was US$347 million, an increase of US$168 million on the<br />
previous year based on comparable fixed exchange rates.<br />
This represents an increase in Return on Capital Invested<br />
(ROCI) from 17% to 22%.<br />
CHEP continues to improve profitability and returns<br />
in all regions.<br />
Continued focus on tight asset management control and<br />
discipline over the use of cash improved CHEP’s cash flow<br />
from operations after net capital expenditure to US$672.2<br />
million, an improvement over last year’s US$605.1 million.<br />
This was against a background of sales growth of 8%.<br />
Average Capital Invested in CHEP Americas was marginally<br />
higher than the previous year at US$1.29 billion, in spite<br />
of 10% sales growth (11% if the impact of the sale of the<br />
RPC assets is excluded).<br />
A very strong profit performance saw comparable<br />
operating profit improve 56% at US$324.9 million.<br />
The combined effect of profit improvement and broadly<br />
constant levels of Capital Invested pushed ROCI for CHEP<br />
Americas up to a record 25%, for the first time exceeding<br />
that of CHEP Europe. Cash flow from operations after<br />
net capital expenditure in CHEP Americas grew from<br />
US$234.2 million to US$296.9 million, largely driven by<br />
profits, offset by increased capital expenditure to meet the<br />
demands of volume growth.<br />
In CHEP Europe, sales growth was 6%, but comparable<br />
operating profit grew significantly by 20% at US$263.6<br />
million. Average Capital Invested reduced from US$1.33<br />
billion to US$1.25 billion, contributing to ROCI of 21%,<br />
up from 17% last year. CHEP Europe also increased cash<br />
flow from operations after net capital expenditure from<br />
US$273.7 million to US$282.9 million.<br />
CHEP Rest of World once again had a good year, with<br />
comparable operating profit growth of 12% exceeding<br />
sales growth of 9%. Average Capital Invested remained<br />
flat at US$0.30 billion helping to lift ROCI to 38%, a<br />
landmark achievement for a CHEP region. Cash flow<br />
from operations after net capital expenditure in CHEP<br />
Rest of World decreased slightly from US$97.2 million<br />
to US$92.4 million.<br />
Recall maintained ROCI of 13% after absorbing the<br />
extra capital invested associated with the acquisition of<br />
AUSDOC for US$191 million, which was recognised on<br />
29 November 2005. Comparable operating profit grew<br />
15% at US$97.5 million.<br />
Discontinued Operations<br />
The results of discontinued operations are distorted by<br />
the effect, under IFRS, of the cessation of depreciation<br />
and equity accounting in relation to assets held for sale.<br />
The table below shows the performance of <strong>Brambles</strong>’<br />
discontinued operations after adjusting for this effect.<br />
Discontinued operations<br />
IFRS<br />
US$m <strong>2006</strong> 2005<br />
Comparable operating profit 310.5 216.0<br />
Constant currency comparable operating profit 319.8 216.0<br />
Cessation of depreciation adjustment (106.3) –<br />
Equity accounted results adjustment 9.3 –<br />
Total adjustments (97.0) –<br />
Underlying constant currency comparable operating profit 222.8 216.0


