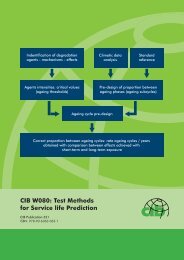
- Page 1 and 2:
Proceedings W116 - Special Track 18
- Page 3 and 4:
W116
‐
- Page 5 and 6:
Inhibitors
Influencing
the
Ad
- Page 7 and 8:
1. Methodology This paper proposes
- Page 9 and 10:
Figure 1: Brazilian Bioclimatic Zon
- Page 11 and 12:
4.2 Guidelines constructive from NB
- Page 13 and 14:
5. Case study 5.1 Sustainable strat
- Page 15 and 16:
Mahoney’s tables. This factor is
- Page 17 and 18:
this matter, and opts for construct
- Page 19 and 20:
Climate Change Related Environmenta
- Page 21 and 22:
2. Construction industry in the ASE
- Page 23 and 24:
eduction targets under the Kyoto Pr
- Page 25 and 26:
causing the governments to take on
- Page 27 and 28:
Availability of specific administra
- Page 29 and 30:
5. National and regional initiative
- Page 31 and 32: The same Article provides further t
- Page 33 and 34: Bisseck P (2003), “FEDEC: An Envi
- Page 35 and 36: Evaluating Approaches for a Sustain
- Page 37 and 38: material extraction in EU-27 in 200
- Page 39 and 40: indications of the water and energy
- Page 41 and 42: Union and other countries worldwide
- Page 43 and 44: 3.3.1 Actions and approaches in the
- Page 45 and 46: uilding materials. Main criteria ar
- Page 47 and 48: Bleischwitz R, Jacob K, Bahn-Walkow
- Page 49 and 50: Oostra M.A.R., H.J Hermeler & L.H v
- Page 51 and 52: Appendix Table 1 Governements, orga
- Page 53 and 54: Table 3 Directions for solutions me
- Page 55 and 56: 1. Introduction The need to preserv
- Page 57 and 58: In 1998 the Federal Government laun
- Page 59 and 60: epairing; installation of water sav
- Page 61 and 62: Table 1: Intervention plan for a fu
- Page 63 and 64: climate, environmental quality of m
- Page 65 and 66: commissioning of the water systems
- Page 67 and 68: Education Challenges for Sustainabl
- Page 69 and 70: 2. Approach A generic green buildin
- Page 71 and 72: Construction • Hold pre-construct
- Page 73 and 74: 3. Analysis of the current teaching
- Page 75 and 76: tradition, however, project-based l
- Page 77 and 78: with full, real-case sustainable de
- Page 79 and 80: The Brazilian Agenda for Sustainabl
- Page 81: The PNCDA developed some Technical
- Page 85 and 86: Table 1: Guidelines for a regional
- Page 87 and 88: Ilha M S O, Oliveira L H, Gonçalve
- Page 89 and 90: 1. Introduction Sustainable design
- Page 91 and 92: (3) Energy efficiency: Energy effic
- Page 93 and 94: Figure 2: Simplified Feng Shui Mode
- Page 95 and 96: Figure 5: Location of Workplace6 (S
- Page 97 and 98: Figure 9: View of Central Atrium (S
- Page 99 and 100: attributes, such as, light, thermal
- Page 101 and 102: McLennan, J.F. (2004) The Philosoph
- Page 103 and 104: 1. Introduction The term “green
- Page 105 and 106: Udechukwu and Johnson (2008) descri
- Page 107 and 108: Household lighting alone will thus
- Page 109 and 110: 4. Research method In adopting a su
- Page 111 and 112: Archiving/Storage facilities 0.699
- Page 113 and 114: therefore be encouraged to use inve
- Page 115 and 116: Managing Quality and Environmental
- Page 117 and 118: development of a computer-based sys
- Page 119 and 120: 4. The action research case study A
- Page 121 and 122: * * NCP_NC 1..* * 0..1 BusinessPart
- Page 123 and 124: Figure 3 shows one of the forms for
- Page 125 and 126: Dubinski J. Gruszka E. and Krodkiew
- Page 127 and 128: Smith M. and Smith D. (2007), Imple
- Page 129 and 130: 1. Introduction In this article a m
- Page 131 and 132: county function of the value of the
- Page 133 and 134:
• Difficulty in generalizing resu
- Page 135 and 136:
Dalkey, N. C. (1969). Memorandum RM
- Page 137 and 138:
1. Introduction: Drivers and invest
- Page 139 and 140:
that set out housing development in
- Page 141 and 142:
would consist of zilch underdevelop
- Page 143 and 144:
of this statement was to enable pla
- Page 145 and 146:
government intention for such devel
- Page 147 and 148:
Barker K (2004) Review of Housing S
- Page 149 and 150:
Planning Policy Guidance Note 3: Ho
- Page 151 and 152:
1. Introduction 1.1 Background to t
- Page 153 and 154:
Table 1: Contrasts between the conc
- Page 155 and 156:
their contribution Community empowe
- Page 157 and 158:
Literature review Carefully map the
- Page 159 and 160:
Facilities Management (FM) New FM a
- Page 161 and 162:
Pearce, J. (2003) Social Enterprise
- Page 163 and 164:
1. Introduction According to Edward
- Page 165 and 166:
Figure 1: Three Perspectives on sus
- Page 167 and 168:
Instead, their main concern is mere
- Page 169 and 170:
• Both cement stabilised products
- Page 171 and 172:
implementation of earth as an alter
- Page 173 and 174:
Smith, E. W. and Austin, G. S. (198
- Page 175 and 176:
1. Introduction According to Morton
- Page 177 and 178:
13. Earth buildings provide better
- Page 179 and 180:
Figure 1: Inhibitors of earth const
- Page 181 and 182:
4. Inhibitors influencing the adopt
- Page 183 and 184:
Blondet, M. and Aguilar, R. (2007).
- Page 185 and 186:
Mubaiwa, A. (2002). Earth as an alt
- Page 187 and 188:
1. Introduction Concrete is a compo
- Page 189 and 190:
Figure 1 Carbon flows through cemen
- Page 191 and 192:
with 25% replacement obtained pract
- Page 193 and 194:
0.6mm in diameter after crushed. In
- Page 195 and 196:
concrete and the impurities present
- Page 197 and 198:
Tawfik M E and Eskander S B. (2006)
- Page 199 and 200:
1. Introduction After Industrial Re
- Page 201 and 202:
2.2 Goal and scope Acquiring from e
- Page 203 and 204:
Table 2 shows that, quantity of raw
- Page 205 and 206:
national environmental agencies hav
- Page 207 and 208:
claddings and especially waterproof
- Page 209 and 210:
Acknowledgement The authors gratefu
- Page 211 and 212:
1. Introduction 1.1 Urban constrain
- Page 213 and 214:
countries (Cole and Larsson, 2002);
- Page 215 and 216:
emissions environment Solid waste R
- Page 217 and 218:
The systems approach is similar, al
- Page 219 and 220:
alternative means of transportation
- Page 221 and 222:
Flexibility SU3 Adaptability SU4 SU
- Page 223 and 224:
References Richard Rogers and Phili
- Page 225 and 226:
1. Introduction During the last few
- Page 227 and 228:
Regardless of its popularity, emerg
- Page 229 and 230:
emoans the fact that of the plethor
- Page 231 and 232:
3.3.2 Buildings Zimmermann et al. (
- Page 233 and 234:
3.3.5 Energy generation and transmi
- Page 235 and 236:
Kennedy, C., Bristow, D. et al., 20
- Page 237 and 238:
Linking Energy and Maintenance Mana
- Page 239 and 240:
Building Energy Performance Needed
- Page 241 and 242:
2.1 2.1 Case study #1, District Lev
- Page 243 and 244:
UCSF Facilities Management Group. T
- Page 245 and 246:
2.3 Case study #3, Central Plant BA
- Page 247 and 248:
2.3.4 Lessons learned The following
- Page 249 and 250:
• Return on investment (ROI) •
- Page 251 and 252:
Ring, P. (2006). The Application of
- Page 253 and 254:
1. Introduction “Physical archite
- Page 255 and 256:
independent living and help to crea
- Page 257 and 258:
our ways of living creating the sen
- Page 259 and 260:
An issue to consider is that Ambien
- Page 261 and 262:
sensorial diseases / impairments is
- Page 263 and 264:
Eurostat (2007) Population and soci
- Page 265 and 266:
1. Introduction Information regardi
- Page 267 and 268:
economic opportunities on the other
- Page 269 and 270:
accommodate a total population esti
- Page 271 and 272:
• population and structure owners
- Page 273 and 274:
3.3.4 Discussion of Results Documen
- Page 275 and 276:
4.1 Using the results for decision
- Page 277 and 278:
4.2 Enhancing participation using G
- Page 279 and 280:
4. Conclusion The potential uses of
- Page 281 and 282:
Schlossberg, M. and Shuford, E. (20
- Page 283 and 284:
1. Introduction The purpose of this
- Page 285 and 286:
and evaluation of the surrounding u
- Page 287 and 288:
• the use of multiple methods and
- Page 289 and 290:
complex, with the creation of a bio
- Page 291 and 292:
Thus, made these considerations of
- Page 293 and 294:
A Life-Cycle Approach to Reducing R
- Page 295 and 296:
“4. Accept the responsibility for
- Page 297 and 298:
The following analysis describes th
- Page 299 and 300:
words, using existing building mate
- Page 301 and 302:
90% by using recovered materials. O
- Page 303 and 304:
Assigning direct costs to selected
- Page 305 and 306:
Napier, Thomas R., D. McKay, and N.
- Page 307 and 308:
“Black Box Opener” Tool to Asse
- Page 309 and 310:
2.1 The main characteristics of ind
- Page 311 and 312:
design in the use of resources, imp
- Page 313 and 314:
Shen et al (2004) developed a descr
- Page 315 and 316:
initial data collection is carried
- Page 317 and 318:
Gavilan R M and Bernold L E (1994)
- Page 319 and 320:
International Council for Research
- Page 321:
CIB General Secretariat post box 18


