Original GBL Prospectus - Gabelli
Original GBL Prospectus - Gabelli
Original GBL Prospectus - Gabelli

You also want an ePaper? Increase the reach of your titles
YUMPU automatically turns print PDFs into web optimized ePapers that Google loves.
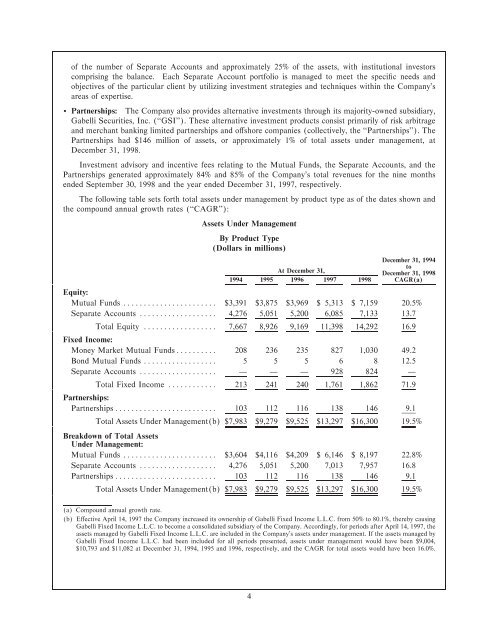
of the number of Separate Accounts and approximately 25% of the assets, with institutional investors<br />
comprising the balance. Each Separate Account portfolio is managed to meet the speciÑc needs and<br />
objectives of the particular client by utilizing investment strategies and techniques within the Company's<br />
areas of expertise.<br />
‚ Partnerships: The Company also provides alternative investments through its majority-owned subsidiary,<br />
<strong>Gabelli</strong> Securities, Inc. (""GSI''). These alternative investment products consist primarily of risk arbitrage<br />
and merchant banking limited partnerships and oÅshore companies (collectively, the ""Partnerships''). The<br />
Partnerships had $146 million of assets, or approximately 1% of total assets under management, at<br />
December 31, 1998.<br />
Investment advisory and incentive fees relating to the Mutual Funds, the Separate Accounts, and the<br />
Partnerships generated approximately 84% and 85% of the Company's total revenues for the nine months<br />
ended September 30, 1998 and the year ended December 31, 1997, respectively.<br />
The following table sets forth total assets under management by product type as of the dates shown and<br />
the compound annual growth rates (""CAGR''):<br />
Assets Under Management<br />
By Product Type<br />
(Dollars in millions)<br />
December 31, 1994<br />
At December 31,<br />
to<br />
December 31, 1998<br />
1994 1995 1996 1997 1998 CAGR(a)<br />
Equity:<br />
Mutual Funds ÏÏÏÏÏÏÏÏÏÏÏÏÏÏÏÏÏÏÏÏÏÏÏ $3,391 $3,875 $3,969 $ 5,313 $ 7,159 20.5%<br />
Separate Accounts ÏÏÏÏÏÏÏÏÏÏÏÏÏÏÏÏÏÏÏ 4,276 5,051 5,200 6,085 7,133 13.7<br />
Total Equity ÏÏÏÏÏÏÏÏÏÏÏÏÏÏÏÏÏÏ 7,667 8,926 9,169 11,398 14,292 16.9<br />
Fixed Income:<br />
Money Market Mutual FundsÏÏÏÏÏÏÏÏÏÏ 208 236 235 827 1,030 49.2<br />
Bond Mutual Funds ÏÏÏÏÏÏÏÏÏÏÏÏÏÏÏÏÏÏ 5 5 5 6 8 12.5<br />
Separate Accounts ÏÏÏÏÏÏÏÏÏÏÏÏÏÏÏÏÏÏÏ Ì Ì Ì 928 824 Ì<br />
Total Fixed Income ÏÏÏÏÏÏÏÏÏÏÏÏ 213 241 240 1,761 1,862 71.9<br />
Partnerships:<br />
Partnerships ÏÏÏÏÏÏÏÏÏÏÏÏÏÏÏÏÏÏÏÏÏÏÏÏÏ 103 112 116 138 146 9.1<br />
Total Assets Under Management(b) $7,983 $9,279 $9,525 $13,297 $16,300 19.5%<br />
Breakdown of Total Assets<br />
Under Management:<br />
Mutual Funds ÏÏÏÏÏÏÏÏÏÏÏÏÏÏÏÏÏÏÏÏÏÏÏ $3,604 $4,116 $4,209 $ 6,146 $ 8,197 22.8%<br />
Separate Accounts ÏÏÏÏÏÏÏÏÏÏÏÏÏÏÏÏÏÏÏ 4,276 5,051 5,200 7,013 7,957 16.8<br />
Partnerships ÏÏÏÏÏÏÏÏÏÏÏÏÏÏÏÏÏÏÏÏÏÏÏÏÏ 103 112 116 138 146 9.1<br />
Total Assets Under Management(b) $7,983 $9,279 $9,525 $13,297 $16,300 19.5%<br />
(a) Compound annual growth rate.<br />
(b) EÅective April 14, 1997 the Company increased its ownership of <strong>Gabelli</strong> Fixed Income L.L.C. from 50% to 80.1%, thereby causing<br />
<strong>Gabelli</strong> Fixed Income L.L.C. to become a consolidated subsidiary of the Company. Accordingly, for periods after April 14, 1997, the<br />
assets managed by <strong>Gabelli</strong> Fixed Income L.L.C. are included in the Company's assets under management. If the assets managed by<br />
<strong>Gabelli</strong> Fixed Income L.L.C. had been included for all periods presented, assets under management would have been $9,004,<br />
$10,793 and $11,082 at December 31, 1994, 1995 and 1996, respectively, and the CAGR for total assets would have been 16.0%.<br />
4