Chemring Group PLC |Annual Report and Accounts 2012
Chemring Group PLC |Annual Report and Accounts 2012
Chemring Group PLC |Annual Report and Accounts 2012
Create successful ePaper yourself
Turn your PDF publications into a flip-book with our unique Google optimized e-Paper software.
20<br />
Business review<br />
Key performance indicators<br />
The <strong>Group</strong>’s strategy is underpinned by focusing on a number of<br />
key financial performance indicators. The key indicators that the<br />
Board utilises to assess <strong>Group</strong> performance are set out below.<br />
Similar indicators are used to review performance in each of the<br />
<strong>Group</strong>’s businesses. Details of non-financial performance indicators<br />
are set out in the corporate responsibility review.<br />
The Board considers that the measurement of underlying <strong>and</strong><br />
divisional operating profit provides additional useful information<br />
for users.<br />
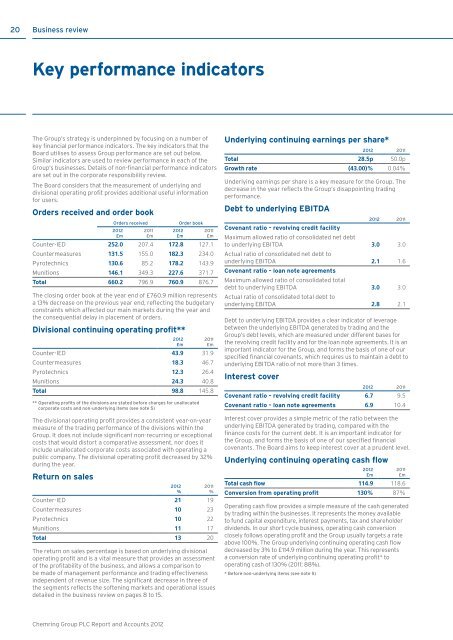
Orders received <strong>and</strong> order book<br />
Orders received<br />
<strong>2012</strong><br />
£m<br />
2011<br />
£m<br />
Order book<br />
<strong>2012</strong><br />
£m<br />
2011<br />
£m<br />
Counter-IED 252.0 207.4 172.8 127.1<br />
Countermeasures 131.5 155.0 182.3 234.0<br />
Pyrotechnics 130.6 85.2 178.2 143.9<br />
Munitions 146.1 349.3 227.6 371.7<br />
Total 660.2 796.9 760.9 876.7<br />
The closing order book at the year end of £760.9 million represents<br />
a 13% decrease on the previous year end, reflecting the budgetary<br />
constraints which affected our main markets during the year <strong>and</strong><br />
the consequential delay in placement of orders.<br />
Divisional continuing operating profit**<br />
<strong>2012</strong><br />
£m<br />
2011<br />
£m<br />
Counter-IED 43.9 31.9<br />
Countermeasures 18.3 46.7<br />
Pyrotechnics 12.3 26.4<br />
Munitions 24.3 40.8<br />
Total 98.8 145.8<br />
** Operating profits of the divisions are stated before charges for unallocated<br />
corporate costs <strong>and</strong> non-underlying items (see note 5)<br />
The divisional operating profit provides a consistent year-on-year<br />
measure of the trading performance of the divisions within the<br />
<strong>Group</strong>. It does not include significant non-recurring or exceptional<br />
costs that would distort a comparative assessment, nor does it<br />
include unallocated corporate costs associated with operating a<br />
public company. The divisional operating profit decreased by 32%<br />
during the year.<br />
Return on sales<br />
<strong>2012</strong><br />
%<br />
2011<br />
%<br />
Counter-IED 21 19<br />
Countermeasures 10 23<br />
Pyrotechnics 10 22<br />
Munitions 11 17<br />
Total 13 20<br />
The return on sales percentage is based on underlying divisional<br />
operating profit <strong>and</strong> is a vital measure that provides an assessment<br />
of the profitability of the business, <strong>and</strong> allows a comparison to<br />
be made of management performance <strong>and</strong> trading effectiveness<br />
independent of revenue size. The significant decrease in three of<br />
the segments reflects the softening markets <strong>and</strong> operational issues<br />
detailed in the business review on pages 8 to 15.<br />
Underlying continuing earnings per share*<br />
<strong>2012</strong> 2011<br />
Total 28.5p 50.0p<br />
Growth rate (43.00)% 0.04%<br />
Underlying earnings per share is a key measure for the <strong>Group</strong>. The<br />
decrease in the year reflects the <strong>Group</strong>’s disappointing trading<br />
performance.<br />
Debt to underlying EBITDA<br />
<strong>2012</strong> 2011<br />
Covenant ratio – revolving credit facility<br />
Maximum allowed ratio of consolidated net debt<br />
to underlying EBITDA 3.0 3.0<br />
Actual ratio of consolidated net debt to<br />
underlying EBITDA 2.1 1.6<br />
Covenant ratio – loan note agreements<br />
Maximum allowed ratio of consolidated total<br />
debt to underlying EBITDA 3.0 3.0<br />
Actual ratio of consolidated total debt to<br />
underlying EBITDA 2.8 2.1<br />
Debt to underlying EBITDA provides a clear indicator of leverage<br />
between the underlying EBITDA generated by trading <strong>and</strong> the<br />
<strong>Group</strong>’s debt levels, which are measured under different bases for<br />
the revolving credit facility <strong>and</strong> for the loan note agreements. It is an<br />
important indicator for the <strong>Group</strong>, <strong>and</strong> forms the basis of one of our<br />
specified financial covenants, which requires us to maintain a debt to<br />
underlying EBITDA ratio of not more than 3 times.<br />
Interest cover<br />
<strong>2012</strong> 2011<br />
Covenant ratio – revolving credit facility 6.7 9.5<br />
Covenant ratio – loan note agreements 6.9 10.4<br />
Interest cover provides a simple metric of the ratio between the<br />
underlying EBITDA generated by trading, compared with the<br />
finance costs for the current debt. It is an important indicator for<br />
the <strong>Group</strong>, <strong>and</strong> forms the basis of one of our specified financial<br />
covenants. The Board aims to keep interest cover at a prudent level.<br />
Underlying continuing operating cash flow<br />
<strong>2012</strong><br />
£m<br />
2011<br />
£m<br />
Total cash flow 114.9 118.6<br />
Conversion from operating profit 130% 87%<br />
Operating cash flow provides a simple measure of the cash generated<br />
by trading within the businesses. It represents the money available<br />
to fund capital expenditure, interest payments, tax <strong>and</strong> shareholder<br />
dividends. In our short cycle business, operating cash conversion<br />
closely follows operating profit <strong>and</strong> the <strong>Group</strong> usually targets a rate<br />
above 100%. The <strong>Group</strong> underlying continuing operating cash flow<br />
decreased by 3% to £114.9 million during the year. This represents<br />
a conversion rate of underlying continuing operating profit* to<br />
operating cash of 130% (2011: 88%).<br />
* Before non-underlying items (see note 5)<br />
<strong>Chemring</strong> <strong>Group</strong> <strong>PLC</strong> <strong>Report</strong> <strong>and</strong> <strong>Accounts</strong> <strong>2012</strong>


