Chemring Group PLC |Annual Report and Accounts 2012
Chemring Group PLC |Annual Report and Accounts 2012
Chemring Group PLC |Annual Report and Accounts 2012

Create successful ePaper yourself
Turn your PDF publications into a flip-book with our unique Google optimized e-Paper software.
68<br />
Financial statements<br />
Notes to the group financial statements<br />
5. Business segments continued<br />
The accounting policies of the reportable segments are the same as the <strong>Group</strong>’s accounting policies described in note 3. Segment profit<br />
represents the profit earned by each segment, without allocation of corporate costs including directors’ salaries, exceptional items, the share<br />
of profit of associates, finance income <strong>and</strong> expense, <strong>and</strong> income tax expense. This is the measure reported to the <strong>Group</strong> Chief Executive for<br />
the purpose of resource allocation <strong>and</strong> assessment of segment performance.<br />
Unallocated corporate costs<br />
Unallocated corporate costs were £10.5 million, slightly up on 2011, due largely to the costs associated with the <strong>Group</strong>’s London office,<br />
which has been vacated since the year end.<br />
Intra-group transactions<br />
There are no material intra-group transactions included within the above figures for revenue <strong>and</strong> profit.<br />
Restructuring <strong>and</strong> incident costs<br />
In <strong>2012</strong>, the restructuring costs related to the closure of the <strong>Group</strong>’s Marshall, Texas site (£3.3 million), the restructuring of the <strong>Group</strong>’s US<br />
countermeasures businesses (£2.5 million), the restructuring of the <strong>Group</strong>’s UK operations (£2.6 million), <strong>and</strong> an additional £1.5 million<br />
relating to several smaller restructuring projects. There were also a number of Board changes during the year, resulting in associated<br />
costs of £2.0 million. Further details of the compensation for loss of office payments of £1.1 million <strong>and</strong> deferred share awards worth<br />
£0.3 million received by two of the former executive directors are set out in the directors’ remuneration report. The balance of the costs<br />
relate to recruitment, <strong>and</strong> various other legal <strong>and</strong> professional fees. There is a £1.8 million difference between the expense in the income<br />
statement <strong>and</strong> the amount appearing in the cash flow statement which relates to timing differences <strong>and</strong> non-cash movements.<br />
Information about major customers<br />
Included in revenues arising from the segments are revenues of approximately £289.6 million (2011: £246.6 million) <strong>and</strong> £89.7 million<br />
(2011: £103.6 million), which arose from sales to the <strong>Group</strong>’s two largest customers respectively. The largest customer had sales reported<br />
in all four of the <strong>Group</strong>’s reporting segments, whilst sales to the second largest customer were primarily from the Munitions segment.<br />
These were the only individual customers where direct sales account for more than 10% of the total <strong>Group</strong> revenue for the year.<br />
The <strong>Group</strong> does not disclose assets or liabilities by segment in the monthly management accounts provided to the Executive Committee<br />
or the Board of Directors. The Improvements to IFRSs issued in April 2009 only requires information provided to the chief operating<br />
decision maker as a key decision making tool to be disclosed. The <strong>Group</strong> has adopted this amendment in order to clarify that the<br />
chief operational decision makers do not use this as a key decision tool. IFRS 8 Operating Segments requires a geographic analysis of<br />
non‐current assets, <strong>and</strong> a disclosure of non-current assets by location is therefore shown below.<br />
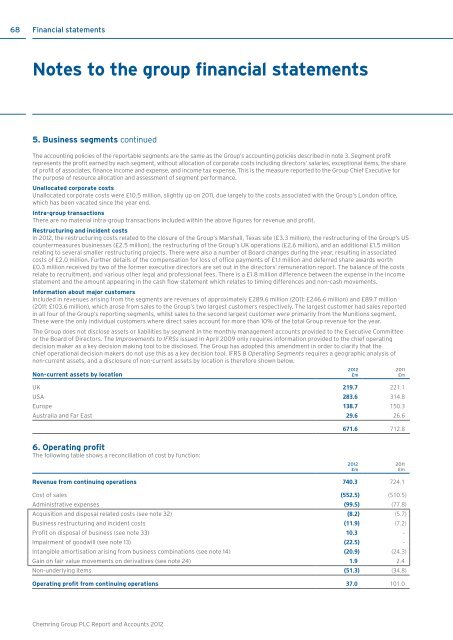
Non-current assets by location<br />
UK 219.7 221.1<br />
USA 283.6 314.8<br />
Europe 138.7 150.3<br />
Australia <strong>and</strong> Far East 29.6 26.6<br />
<strong>2012</strong><br />
£m<br />
2011<br />
£m<br />
671.6 712.8<br />
6. Operating profit<br />
The following table shows a reconciliation of cost by function:<br />
<strong>2012</strong><br />
£m<br />
2011<br />
£m<br />
Revenue from continuing operations 740.3 724.1<br />
Cost of sales (552.5) (510.5)<br />
Administrative expenses (99.5) (77.8)<br />
Acquisition <strong>and</strong> disposal related costs (see note 32) (8.2) (5.7)<br />
Business restructuring <strong>and</strong> incident costs (11.9) (7.2)<br />
Profit on disposal of business (see note 33) 10.3 -<br />
Impairment of goodwill (see note 13) (22.5) -<br />
Intangible amortisation arising from business combinations (see note 14) (20.9) (24.3)<br />
Gain on fair value movements on derivatives (see note 24) 1.9 2.4<br />
Non-underlying items (51.3) (34.8)<br />
Operating profit from continuing operations 37.0 101.0<br />
<strong>Chemring</strong> <strong>Group</strong> <strong>PLC</strong> <strong>Report</strong> <strong>and</strong> <strong>Accounts</strong> <strong>2012</strong>