Chemring Group PLC |Annual Report and Accounts 2012
Chemring Group PLC |Annual Report and Accounts 2012
Chemring Group PLC |Annual Report and Accounts 2012
You also want an ePaper? Increase the reach of your titles
YUMPU automatically turns print PDFs into web optimized ePapers that Google loves.
80<br />
Financial statements<br />
Notes to the group financial statements<br />
21. Borrowings continued<br />
Bank<br />
loans <strong>and</strong><br />
overdrafts<br />
£m<br />
Loan<br />
notes<br />
£m<br />
Other<br />
loans*<br />
£m<br />
<strong>2012</strong><br />
Total<br />
£m<br />
Bank<br />
loans <strong>and</strong><br />
overdrafts<br />
£m<br />
Loan<br />
notes<br />
£m<br />
Other<br />
loans*<br />
£m<br />
2011<br />
Total<br />
£m<br />
Borrowings falling due within:<br />
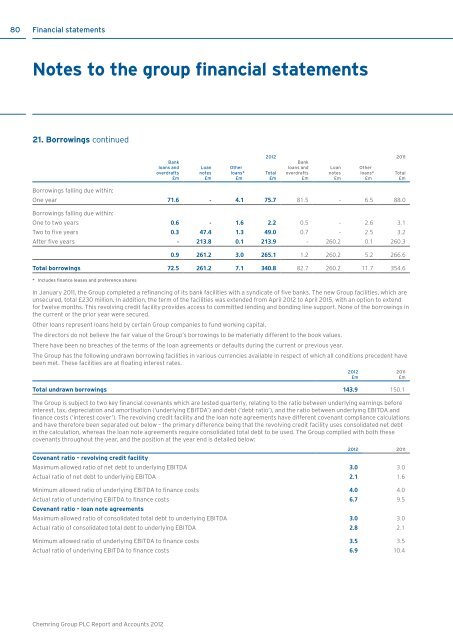
One year 71.6 - 4.1 75.7 81.5 - 6.5 88.0<br />
Borrowings falling due within:<br />
One to two years 0.6 - 1.6 2.2 0.5 - 2.6 3.1<br />
Two to five years 0.3 47.4 1.3 49.0 0.7 - 2.5 3.2<br />
After five years - 213.8 0.1 213.9 - 260.2 0.1 260.3<br />
0.9 261.2 3.0 265.1 1.2 260.2 5.2 266.6<br />
Total borrowings 72.5 261.2 7.1 340.8 82.7 260.2 11.7 354.6<br />
* Includes finance leases <strong>and</strong> preference shares<br />
In January 2011, the <strong>Group</strong> completed a refinancing of its bank facilities with a syndicate of five banks. The new <strong>Group</strong> facilities, which are<br />
unsecured, total £230 million. In addition, the term of the facilities was extended from April <strong>2012</strong> to April 2015, with an option to extend<br />
for twelve months. This revolving credit facility provides access to committed lending <strong>and</strong> bonding line support. None of the borrowings in<br />
the current or the prior year were secured.<br />
Other loans represent loans held by certain <strong>Group</strong> companies to fund working capital.<br />
The directors do not believe the fair value of the <strong>Group</strong>’s borrowings to be materially different to the book values.<br />
There have been no breaches of the terms of the loan agreements or defaults during the current or previous year.<br />
The <strong>Group</strong> has the following undrawn borrowing facilities in various currencies available in respect of which all conditions precedent have<br />
been met. These facilities are at floating interest rates.<br />
Total undrawn borrowings 143.9 150.1<br />
The <strong>Group</strong> is subject to two key financial covenants which are tested quarterly, relating to the ratio between underlying earnings before<br />
interest, tax, depreciation <strong>and</strong> amortisation (‘underlying EBITDA’) <strong>and</strong> debt (‘debt ratio’), <strong>and</strong> the ratio between underlying EBITDA <strong>and</strong><br />
finance costs (‘interest cover’). The revolving credit facility <strong>and</strong> the loan note agreements have different covenant compliance calculations<br />
<strong>and</strong> have therefore been separated out below – the primary difference being that the revolving credit facility uses consolidated net debt<br />
in the calculation, whereas the loan note agreements require consolidated total debt to be used. The <strong>Group</strong> complied with both these<br />
covenants throughout the year, <strong>and</strong> the position at the year end is detailed below:<br />
<strong>2012</strong> 2011<br />
Covenant ratio – revolving credit facility<br />
Maximum allowed ratio of net debt to underlying EBITDA 3.0 3.0<br />
Actual ratio of net debt to underlying EBITDA 2.1 1.6<br />
Minimum allowed ratio of underlying EBITDA to finance costs 4.0 4.0<br />
Actual ratio of underlying EBITDA to finance costs 6.7 9.5<br />
Covenant ratio – loan note agreements<br />
Maximum allowed ratio of consolidated total debt to underlying EBITDA 3.0 3.0<br />
Actual ratio of consolidated total debt to underlying EBITDA 2.8 2.1<br />
Minimum allowed ratio of underlying EBITDA to finance costs 3.5 3.5<br />
Actual ratio of underlying EBITDA to finance costs 6.9 10.4<br />
<strong>2012</strong><br />
£m<br />
2011<br />
£m<br />
<strong>Chemring</strong> <strong>Group</strong> <strong>PLC</strong> <strong>Report</strong> <strong>and</strong> <strong>Accounts</strong> <strong>2012</strong>


