Chemring Group PLC |Annual Report and Accounts 2012
Chemring Group PLC |Annual Report and Accounts 2012
Chemring Group PLC |Annual Report and Accounts 2012

You also want an ePaper? Increase the reach of your titles
YUMPU automatically turns print PDFs into web optimized ePapers that Google loves.
94<br />
Financial statements<br />
Notes to the group financial statements<br />
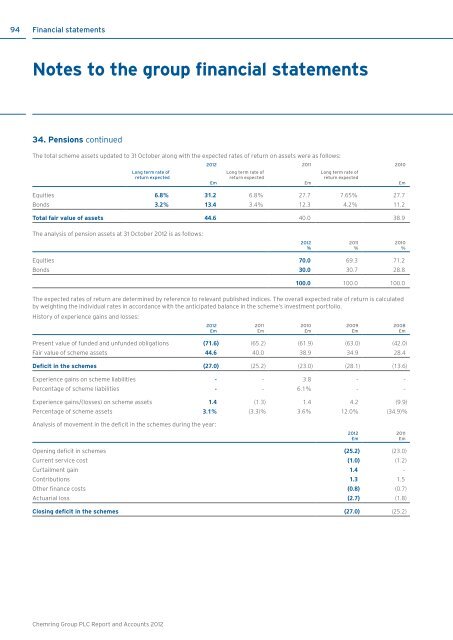
34. Pensions continued<br />
The total scheme assets updated to 31 October along with the expected rates of return on assets were as follows:<br />
Long term rate of<br />
return expected<br />
<strong>2012</strong> 2011 2010<br />
£m<br />
Long term rate of<br />
return expected<br />
£m<br />
Long term rate of<br />
return expected<br />
Equities 6.8% 31.2 6.8% 27.7 7.65% 27.7<br />
Bonds 3.2% 13.4 3.4% 12.3 4.2% 11.2<br />
Total fair value of assets 44.6 40.0 38.9<br />
£m<br />
The analysis of pension assets at 31 October <strong>2012</strong> is as follows:<br />
<strong>2012</strong><br />
%<br />
2011<br />
%<br />
2010<br />
%<br />
Equities 70.0 69.3 71.2<br />
Bonds 30.0 30.7 28.8<br />
100.0 100.0 100.0<br />
The expected rates of return are determined by reference to relevant published indices. The overall expected rate of return is calculated<br />
by weighting the individual rates in accordance with the anticipated balance in the scheme’s investment portfolio.<br />
History of experience gains <strong>and</strong> losses:<br />
<strong>2012</strong><br />
£m<br />
Present value of funded <strong>and</strong> unfunded obligations (71.6) (65.2) (61.9) (63.0) (42.0)<br />
Fair value of scheme assets 44.6 40.0 38.9 34.9 28.4<br />
Deficit in the schemes (27.0) (25.2) (23.0) (28.1) (13.6)<br />
Experience gains on scheme liabilities - - 3.8 - -<br />
Percentage of scheme liabilities - - 6.1% - -<br />
Experience gains/(losses) on scheme assets 1.4 (1.3) 1.4 4.2 (9.9)<br />
Percentage of scheme assets 3.1% (3.3)% 3.6% 12.0% (34.9)%<br />
2011<br />
£m<br />
2010<br />
£m<br />
2009<br />
£m<br />
2008<br />
£m<br />
Analysis of movement in the deficit in the schemes during the year:<br />
<strong>2012</strong><br />
£m<br />
2011<br />
£m<br />
Opening deficit in schemes (25.2) (23.0)<br />
Current service cost (1.0) (1.2)<br />
Curtailment gain 1.4 -<br />
Contributions 1.3 1.5<br />
Other finance costs (0.8) (0.7)<br />
Actuarial loss (2.7) (1.8)<br />
Closing deficit in the schemes (27.0) (25.2)<br />
<strong>Chemring</strong> <strong>Group</strong> <strong>PLC</strong> <strong>Report</strong> <strong>and</strong> <strong>Accounts</strong> <strong>2012</strong>