Chemring Group PLC |Annual Report and Accounts 2012
Chemring Group PLC |Annual Report and Accounts 2012
Chemring Group PLC |Annual Report and Accounts 2012

Create successful ePaper yourself
Turn your PDF publications into a flip-book with our unique Google optimized e-Paper software.
59<br />
Notes to the consolidated<br />
cash flow statement<br />
for the year ended 31 October <strong>2012</strong><br />
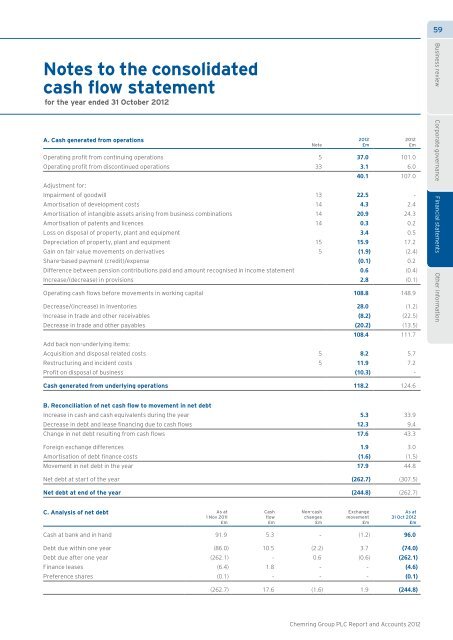
A. Cash generated from operations<br />
Operating profit from continuing operations 5 37.0 101.0<br />
Operating profit from discontinued operations 33 3.1 6.0<br />
Note<br />
<strong>2012</strong><br />
£m<br />
<strong>2012</strong><br />
£m<br />
40.1 107.0<br />
Adjustment for:<br />
Impairment of goodwill 13 22.5 -<br />
Amortisation of development costs 14 4.3 2.4<br />
Amortisation of intangible assets arising from business combinations 14 20.9 24.3<br />
Amortisation of patents <strong>and</strong> licences 14 0.3 0.2<br />
Loss on disposal of property, plant <strong>and</strong> equipment 3.4 0.5<br />
Depreciation of property, plant <strong>and</strong> equipment 15 15.9 17.2<br />
Gain on fair value movements on derivatives 5 (1.9) (2.4)<br />
Share-based payment (credit)/expense (0.1) 0.2<br />
Difference between pension contributions paid <strong>and</strong> amount recognised in income statement 0.6 (0.4)<br />
Increase/(decrease) in provisions 2.8 (0.1)<br />
Operating cash flows before movements in working capital 108.8 148.9<br />
Decrease/(increase) in inventories 28.0 (1.2)<br />
Increase in trade <strong>and</strong> other receivables (8.2) (22.5)<br />
Decrease in trade <strong>and</strong> other payables (20.2) (13.5)<br />
108.4 111.7<br />
Add back non-underlying items:<br />
Acquisition <strong>and</strong> disposal related costs 5 8.2 5.7<br />
Restructuring <strong>and</strong> incident costs 5 11.9 7.2<br />
Profit on disposal of business (10.3) -<br />
Business review Corporate governance Financial statements Other information<br />
Cash generated from underlying operations 118.2 124.6<br />
B. Reconciliation of net cash flow to movement in net debt<br />
Increase in cash <strong>and</strong> cash equivalents during the year 5.3 33.9<br />
Decrease in debt <strong>and</strong> lease financing due to cash flows 12.3 9.4<br />
Change in net debt resulting from cash flows 17.6 43.3<br />
Foreign exchange differences 1.9 3.0<br />
Amortisation of debt finance costs (1.6) (1.5)<br />
Movement in net debt in the year 17.9 44.8<br />
Net debt at start of the year (262.7) (307.5)<br />
Net debt at end of the year (244.8) (262.7)<br />
C. Analysis of net debt As at<br />
1 Nov 2011<br />
£m<br />
Cash<br />
flow<br />
£m<br />
Non-cash<br />
changes<br />
£m<br />
Exchange<br />
movement<br />
£m<br />
As at<br />
31 Oct <strong>2012</strong><br />
£m<br />
Cash at bank <strong>and</strong> in h<strong>and</strong> 91.9 5.3 - (1.2) 96.0<br />
Debt due within one year (86.0) 10.5 (2.2) 3.7 (74.0)<br />
Debt due after one year (262.1) - 0.6 (0.6) (262.1)<br />
Finance leases (6.4) 1.8 - - (4.6)<br />
Preference shares (0.1) - - - (0.1)<br />
(262.7) 17.6 (1.6) 1.9 (244.8)<br />
<strong>Chemring</strong> <strong>Group</strong> <strong>PLC</strong> <strong>Report</strong> <strong>and</strong> <strong>Accounts</strong> <strong>2012</strong>