Astronomical Spectroscopy - Physics - University of Cincinnati
Astronomical Spectroscopy - Physics - University of Cincinnati
Astronomical Spectroscopy - Physics - University of Cincinnati

You also want an ePaper? Increase the reach of your titles
YUMPU automatically turns print PDFs into web optimized ePapers that Google loves.
– 35 –<br />
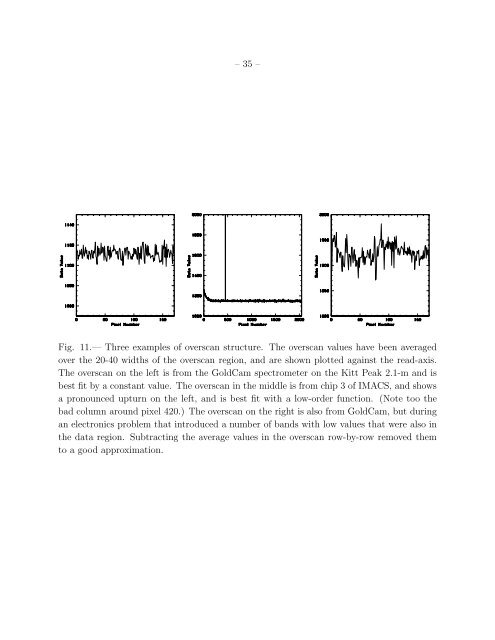
Fig. 11.— Three examples <strong>of</strong> overscan structure. The overscan values have been averaged<br />
over the 20-40 widths <strong>of</strong> the overscan region, and are shown plotted against the read-axis.<br />
The overscan on the left is from the GoldCam spectrometer on the Kitt Peak 2.1-m and is<br />
best fit by a constant value. The overscan in the middle is from chip 3 <strong>of</strong> IMACS, and shows<br />
a pronounced upturn on the left, and is best fit with a low-order function. (Note too the<br />
bad column around pixel 420.) The overscan on the right is also from GoldCam, but during<br />
an electronics problem that introduced a number <strong>of</strong> bands with low values that were also in<br />
the data region. Subtracting the average values in the overscan row-by-row removed them<br />
to a good approximation.