October 2009 - South Tahoe Public Utility District
October 2009 - South Tahoe Public Utility District
October 2009 - South Tahoe Public Utility District

Create successful ePaper yourself
Turn your PDF publications into a flip-book with our unique Google optimized e-Paper software.
AVERAGE Total<br />
Freshwater Delivered<br />
per Irrigation Season<br />
(AF)<br />
Current<br />
Allotted<br />
Recycled Water<br />
Supply (AF)<br />
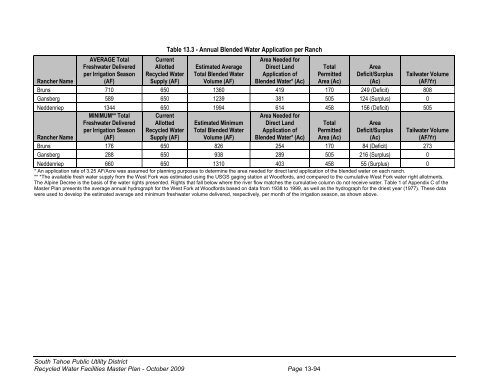
Table 13.3 - Annual Blended Water Application per Ranch<br />
Estimated Average<br />
Total Blended Water<br />
Volume (AF)<br />
Area Needed for<br />
Direct Land<br />
Application of<br />
Blended Water* (Ac)<br />
Total<br />
Permitted<br />
Area (Ac)<br />
Area<br />
Deficit/Surplus<br />
(Ac)<br />
Tailwater Volume<br />
(AF/Yr)<br />
Rancher Name<br />
Bruns 710 650 1360 419 170 249 (Deficit) 808<br />
Gansberg 589 650 1239 381 505 124 (Surplus) 0<br />
Neddenriep 1344 650 1994 614 458 156 (Deficit) 505<br />
Rancher Name<br />
MINIMUM** Total<br />
Freshwater Delivered<br />
per Irrigation Season<br />
(AF)<br />
Current<br />
Allotted<br />
Recycled Water<br />
Supply (AF)<br />
Estimated Minimum<br />
Total Blended Water<br />
Volume (AF)<br />
Area Needed for<br />
Direct Land<br />
Application of<br />
Blended Water* (Ac)<br />
Total<br />
Permitted<br />
Area (Ac)<br />
Area<br />
Deficit/Surplus<br />
(Ac)<br />
Tailwater Volume<br />
(AF/Yr)<br />
Bruns 176 650 826 254 170 84 (Deficit) 273<br />
Gansberg 288 650 938 289 505 216 (Surplus) 0<br />
Neddenriep 660 650 1310 403 458 55 (Surplus) 0<br />
* An application rate of 3.25 AF/Acre was assumed for planning purposes to determine the area needed for direct land application of the blended water on each ranch.<br />
** *The available fresh water supply from the West Fork was estimated using the USGS gaging station at Woodfords, and compared to the cumulative West Fork water right allotments.<br />
The Alpine Decree is the basis of the water rights presented. Rights that fall below where the river flow matches the cumulative column do not receive water. Table 1 of Appendix C of the<br />
Master Plan presents the average annual hydrograph for the West Fork at Woodfords based on data from 1938 to 1999, as well as the hydrograph for the driest year (1977). These data<br />
were used to develop the estimated average and minimum freshwater volume delivered, respectively, per month of the irrigation season, as shown above.<br />
<strong>South</strong> <strong>Tahoe</strong> <strong>Public</strong> <strong>Utility</strong> <strong>District</strong><br />
Recycled Water Facilities Master Plan - <strong>October</strong> <strong>2009</strong> Page 13-94