October 2009 - South Tahoe Public Utility District
October 2009 - South Tahoe Public Utility District
October 2009 - South Tahoe Public Utility District

Create successful ePaper yourself
Turn your PDF publications into a flip-book with our unique Google optimized e-Paper software.
5.2.2 Trend Analysis<br />
The BOD, NO 3 -N, TKN and TP concentrations show a slight increasing trend over the past ten<br />
years (Figures 5.2.1(a-d)). Using these trends to project future average recycled water<br />
concentrations gives a BOD concentration 8.2 mg/L, an NO 3 -N concentration of 0.49 mg/L, a<br />
TKN concentration of 31 mg/L, and a TP concentration of 4.6 mg/L in the year 2028. At the<br />
projected 2028 flow of 5.8 MGD, these concentrations correspond with a BOD load of 397<br />
lb/day, an NO 3 -N load of 23.7 lb/day, a TKN load of 1,501 lb/day and a TP load of 223 lb/day.<br />
BOD, NO 3 -N, TKN and TP are operationally controlled parameters and recycled water<br />
concentrations can be decreased when necessary by applying additional oxygen, bringing<br />
unused aeration basins on line, or modifying aeration basin operational parameters.<br />
The SS concentration shows a slight decreasing trend over the last 10 years, while the TDS,<br />
and Cl concentrations show a slight increasing trend (Figure 5.2.1(e), 5.2.1(f), and 5.2.1(g)).<br />
Using these trends, an SS average recycled water concentration of 1.5 mg/L, a TDS average<br />
recycled water concentration of 305 mg/L, and a Cl average recycled water concentration of 60<br />
mg/l in the year 2028 are projected. At the projected 2028 flow of 5.8 MGD, these<br />
concentrations correspond with a SS load of 73 lb/day, a TDS load of 14,764 lb/day, and a Cl<br />
load of 2,904 lb/day. These concentrations are not affected by additional biological treatment.<br />
Additionally, concentrations of TDS and Cl are expected to rise due to water conservation<br />
efforts.<br />
Several data anomalies are evident in Figure 5.2.1 (b). No explanation is evident as to why the<br />
data anomalies exist. The trend line shown does include the anomaly data input.<br />
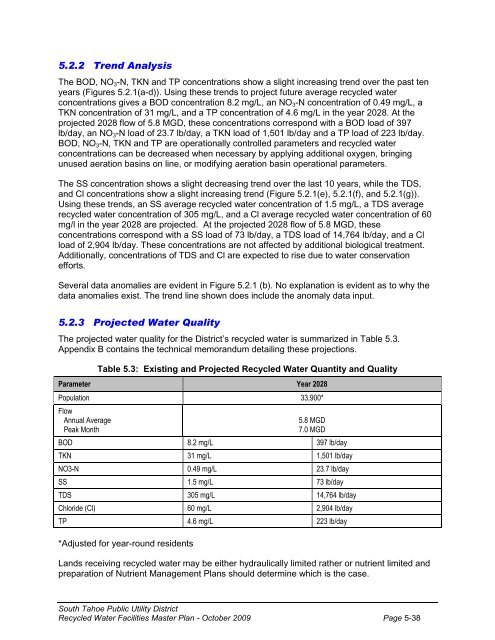
5.2.3 Projected Water Quality<br />
The projected water quality for the <strong>District</strong>‟s recycled water is summarized in Table 5.3.<br />
Appendix B contains the technical memorandum detailing these projections.<br />
Table 5.3: Existing and Projected Recycled Water Quantity and Quality<br />
Parameter Year 2028<br />
Population 33,900*<br />
Flow<br />
Annual Average<br />
Peak Month<br />
5.8 MGD<br />
7.0 MGD<br />
BOD 8.2 mg/L 397 lb/day<br />
TKN 31 mg/L 1,501 lb/day<br />
NO3-N 0.49 mg/L 23.7 lb/day<br />
SS 1.5 mg/L 73 lb/day<br />
TDS 305 mg/L 14,764 lb/day<br />
Chloride (Cl) 60 mg/L 2,904 lb/day<br />
TP 4.6 mg/L 223 lb/day<br />
*Adjusted for year-round residents<br />
Lands receiving recycled water may be either hydraulically limited rather or nutrient limited and<br />
preparation of Nutrient Management Plans should determine which is the case.<br />
<strong>South</strong> <strong>Tahoe</strong> <strong>Public</strong> <strong>Utility</strong> <strong>District</strong><br />
Recycled Water Facilities Master Plan - <strong>October</strong> <strong>2009</strong> Page 5-38