1000 Hydraulics Chapter - Ministry of Transportation
1000 Hydraulics Chapter - Ministry of Transportation
1000 Hydraulics Chapter - Ministry of Transportation

Create successful ePaper yourself
Turn your PDF publications into a flip-book with our unique Google optimized e-Paper software.
BC MoT<br />
SUPPLEMENT TO TAC GEOMETRIC DESIGN GUIDE<br />
MoT Section 1020 TAC Section 2.1.2<br />
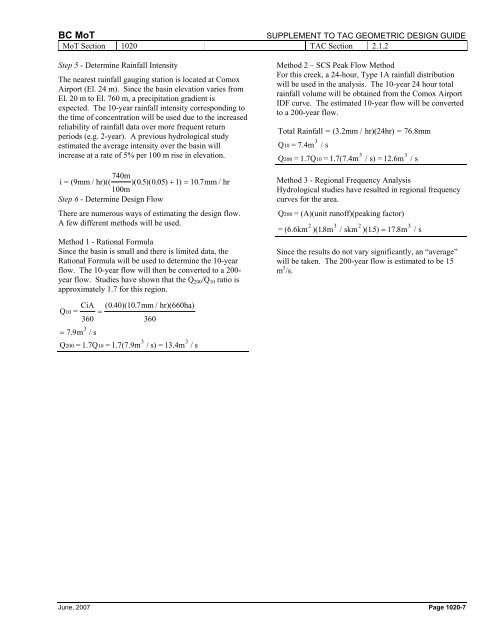
Step 5 - Determine Rainfall Intensity<br />
The nearest rainfall gauging station is located at Comox<br />
Airport (El. 24 m). Since the basin elevation varies from<br />
El. 20 m to El. 760 m, a precipitation gradient is<br />
expected. The 10-year rainfall intensity corresponding to<br />
the time <strong>of</strong> concentration will be used due to the increased<br />
reliability <strong>of</strong> rainfall data over more frequent return<br />
periods (e.g. 2-year). A previous hydrological study<br />
estimated the average intensity over the basin will<br />
increase at a rate <strong>of</strong> 5% per 100 m rise in elevation.<br />
i = (9mm / hr)(( 740m )( 05 . )( 005 . ) + 1) = 107 . mm / hr<br />
100m<br />
Step 6 - Determine Design Flow<br />
There are numerous ways <strong>of</strong> estimating the design flow.<br />
A few different methods will be used.<br />
Method 1 - Rational Formula<br />
Since the basin is small and there is limited data, the<br />
Rational Formula will be used to determine the 10-year<br />
flow. The 10-year flow will then be converted to a 200-<br />
year flow. Studies have shown that the Q 200 /Q 10 ratio is<br />
approximately 1.7 for this region.<br />
Method 2 – SCS Peak Flow Method<br />
For this creek, a 24-hour, Type 1A rainfall distribution<br />
will be used in the analysis. The 10-year 24 hour total<br />
rainfall volume will be obtained from the Comox Airport<br />
IDF curve. The estimated 10-year flow will be converted<br />
to a 200-year flow.<br />
Total Rainfall = (3.2mm / hr)(24hr) = 76.8mm<br />
Q 10 = 7.4m 3 / s<br />
3 3<br />
Q 200 = 1.7Q 10 = 1.7(7.4m / s) = 12.6m / s<br />
Method 3 - Regional Frequency Analysis<br />
Hydrological studies have resulted in regional frequency<br />
curves for the area.<br />
Q<br />
200<br />
= (A)(unit run<strong>of</strong>f)(peaking factor)<br />
2 3 2 3<br />
= (6.6km )( 18 . m / skm )( 15 . ) = 17.8m / s<br />
Since the results do not vary significantly, an “average”<br />
will be taken. The 200-year flow is estimated to be 15<br />
m 3 /s.<br />
Q = CiA ( 040)(107 . . mm / hr)(660ha)<br />
10 =<br />
360<br />
360<br />
3<br />
= 7.9m<br />
/ s<br />
3 3<br />
Q 200 = 1.7Q 10 = 1.7(7.9m / s) = 13.4m / s<br />
June, 2007 Page 1020-7