Annual Report 2004-2005 - Forensicare
Annual Report 2004-2005 - Forensicare
Annual Report 2004-2005 - Forensicare

You also want an ePaper? Increase the reach of your titles
YUMPU automatically turns print PDFs into web optimized ePapers that Google loves.
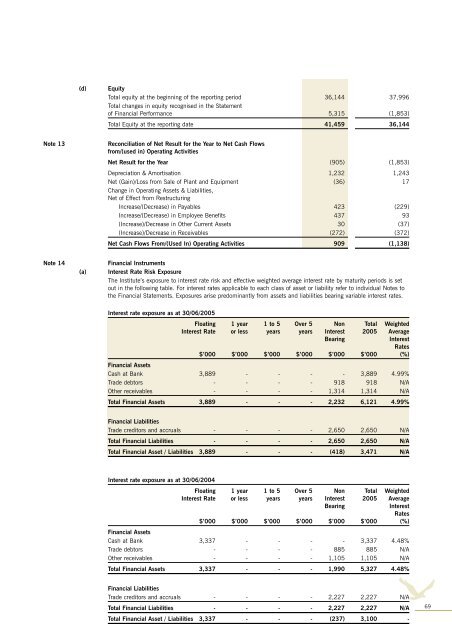
(d)<br />
Equity<br />
Total equity at the beginning of the reporting period 36,144 37,996<br />
Total changes in equity recognised in the Statement<br />
of Financial Performance 5,315 (1,853)<br />
Total Equity at the reporting date 41,459 36,144<br />
Note 13<br />
Reconciliation of Net Result for the Year to Net Cash Flows<br />
from/(used in) Operating Activities<br />
Net Result for the Year (905) (1,853)<br />
Depreciation & Amortisation 1,232 1,243<br />
Net (Gain)/Loss from Sale of Plant and Equipment (36) 17<br />
Change in Operating Assets & Liabilities,<br />
Net of Effect from Restructuring<br />
Increase/(Decrease) in Payables 423 (229)<br />
Increase/(Decrease) in Employee Benefits 437 93<br />
(Increase)/Decrease in Other Current Assets 30 (37)<br />
(Increase)/Decrease in Receivables (272) (372)<br />
Net Cash Flows From/(Used In) Operating Activities 909 (1,138)<br />
Note 14<br />
(a)<br />
Financial Instruments<br />
Interest Rate Risk Exposure<br />
The Institute’s exposure to interest rate risk and effective weighted average interest rate by maturity periods is set<br />
out in the following table. For interest rates applicable to each class of asset or liability refer to individual Notes to<br />
the Financial Statements. Exposures arise predominantly from assets and liabilities bearing variable interest rates.<br />
Interest rate exposure as at 30/06/<strong>2005</strong><br />
Floating 1 year 1 to 5 Over 5 Non Total Weighted<br />
Interest Rate or less years years Interest <strong>2005</strong> Average<br />
Bearing<br />
Interest<br />
Rates<br />
$’000 $’000 $’000 $’000 $’000 $’000 (%)<br />
Financial Assets<br />
Cash at Bank 3,889 - - - - 3,889 4.99%<br />
Trade debtors - - - - 918 918 N/A<br />
Other receivables - - - - 1,314 1,314 N/A<br />
Total Financial Assets 3,889 - - - 2,232 6,121 4.99%<br />
Financial Liabilities<br />
Trade creditors and accruals - - - - 2,650 2,650 N/A<br />
Total Financial Liabilities - - - - 2,650 2,650 N/A<br />
Total Financial Asset / Liabilities 3,889 - - - (418) 3,471 N/A<br />
Interest rate exposure as at 30/06/<strong>2004</strong><br />
Floating 1 year 1 to 5 Over 5 Non Total Weighted<br />
Interest Rate or less years years Interest <strong>2005</strong> Average<br />
Bearing<br />
Interest<br />
Rates<br />
$’000 $’000 $’000 $’000 $’000 $’000 (%)<br />
Financial Assets<br />
Cash at Bank 3,337 - - - - 3,337 4.48%<br />
Trade debtors - - - - 885 885 N/A<br />
Other receivables - - - - 1,105 1,105 N/A<br />
Total Financial Assets 3,337 - - - 1,990 5,327 4.48%<br />
Financial Liabilities<br />
Trade creditors and accruals - - - - 2,227 2,227 N/A<br />
Total Financial Liabilities - - - - 2,227 2,227 N/A<br />
Total Financial Asset / Liabilities 3,337 - - - (237) 3,100 -<br />
69