Å kodaAuto ANNUAL REPORT 2006 - Skoda Auto
Å kodaAuto ANNUAL REPORT 2006 - Skoda Auto
Å kodaAuto ANNUAL REPORT 2006 - Skoda Auto

You also want an ePaper? Increase the reach of your titles
YUMPU automatically turns print PDFs into web optimized ePapers that Google loves.
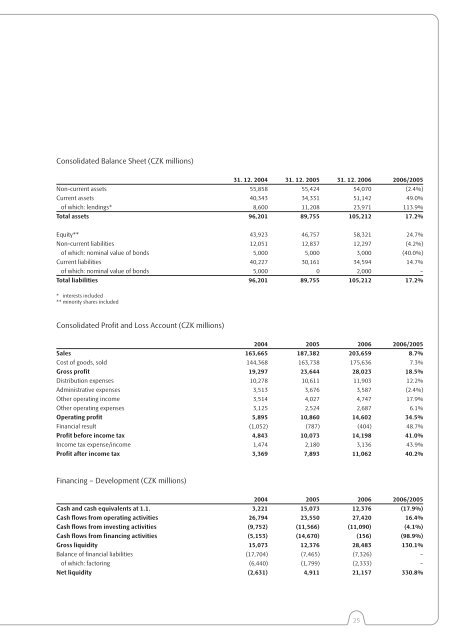
Consolidated Balance Sheet (CZK millions)<br />
31. 12. 2004 31. 12. 2005 31. 12. <strong>2006</strong> <strong>2006</strong>/2005<br />
Non-current assets 55,858 55,424 54,070 (2.4%)<br />
Current assets 40,343 34,331 51,142 49.0%<br />
of which: lendings* 8,600 11,208 23,971 113.9%<br />
Total assets 96,201 89,755 105,212 17.2%<br />
Equity** 43,923 46,757 58,321 24.7%<br />
Non-current liabilities 12,051 12,837 12,297 (4.2%)<br />
of which: nominal value of bonds 5,000 5,000 3,000 (40.0%)<br />
Current liabilities 40,227 30,161 34,594 14.7%<br />
of which: nominal value of bonds 5,000 0 2,000 –<br />
Total liabilities 96,201 89,755 105,212 17.2%<br />
* interests included<br />
** minority shares included<br />
Consolidated Profit and Loss Account (CZK millions)<br />
2004 2005 <strong>2006</strong> <strong>2006</strong>/2005<br />
Sales 163,665 187,382 203,659 8.7%<br />
Cost of goods, sold 144,368 163,738 175,636 7.3%<br />
Gross profit 19,297 23,644 28,023 18.5%<br />
Distribution expenses 10,278 10,611 11,903 12.2%<br />
Administrative expenses 3,513 3,676 3,587 (2.4%)<br />
Other operating income 3,514 4,027 4,747 17.9%<br />
Other operating expenses 3,125 2,524 2,687 6.1%<br />
Operating profit 5,895 10,860 14,602 34.5%<br />
Financial result (1,052) (787) (404) 48.7%<br />
Profit before income tax 4,843 10,073 14,198 41.0%<br />
Income tax expense/income 1,474 2,180 3,136 43.9%<br />
Profit after income tax 3,369 7,893 11,062 40.2%<br />
Financing – Development (CZK millions)<br />
2004 2005 <strong>2006</strong> <strong>2006</strong>/2005<br />
Cash and cash equivalents at 1.1. 3,221 15,073 12,376 (17.9%)<br />
Cash flows from operating activities 26,794 23,550 27,420 16.4%<br />
Cash flows from investing activities (9,752) (11,566) (11,090) (4.1%)<br />
Cash flows from financing activities (5,153) (14,670) (156) (98.9%)<br />
Gross liquidity 15,073 12,376 28,483 130.1%<br />
Balance of financial liabilities (17,704) (7,465) (7,326) –<br />
of which: factoring (6,440) (1,799) (2,333) –<br />
Net liquidity (2,631) 4,911 21,157 330.8%<br />
25