2012 Results - Essilor
2012 Results - Essilor
2012 Results - Essilor

You also want an ePaper? Increase the reach of your titles
YUMPU automatically turns print PDFs into web optimized ePapers that Google loves.
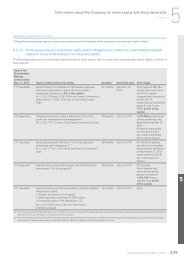
Strategy Delivering Consistent and Visible <strong>Results</strong><br />
Contribution from operations (1)<br />
Earnings per share<br />
Free cash flow (2)<br />
894<br />
In € millions In €<br />
In € millions<br />
597<br />
748<br />
+19.5%<br />
2.44<br />
2.80<br />
463<br />
+28.9%<br />
+14.7%<br />
2011 2011 <strong>2012</strong><br />
2011 2011 <strong>2012</strong><br />
<strong>2012</strong><br />
2011 2011<br />
<strong>2012</strong><br />
(1) Operating profit before compensation costs of share-based payments, restructuring costs, other income & expense and goodwill impairment<br />
(2) Free cash flow = Net cash from operating activities less change in WCR and less net capital expenditure.<br />
<strong>2012</strong> <strong>Results</strong><br />
10