2012 Results - Essilor
2012 Results - Essilor
2012 Results - Essilor

Create successful ePaper yourself
Turn your PDF publications into a flip-book with our unique Google optimized e-Paper software.
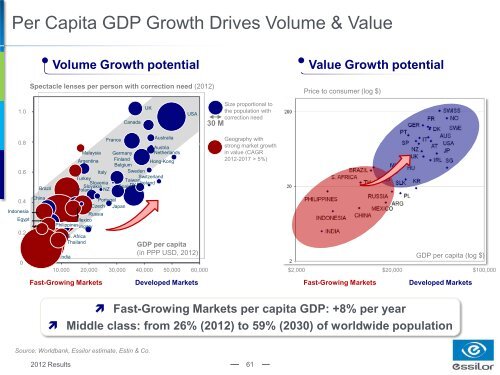
Per Capita GDP Growth Drives Volume & Value<br />
Volume Growth potential<br />
Spectacle lenses per person with correction need (<strong>2012</strong>)<br />
Value Growth potential<br />
Price to consumer (log $)<br />
1.0 1,0<br />
Canada<br />
UK<br />
USA<br />
Size proportional to<br />
the population with<br />
correction need<br />
30 M<br />
0.8 0,8<br />
0.6 0,6<br />
0.4 0,4<br />
Indonesia<br />
Egypt<br />
0.2 0,2<br />
0,0<br />
Brazil<br />
China<br />
Russia<br />
Mexico<br />
Philippines Hungary<br />
India<br />
0 10,000 10000 20,000 20000 30,000 30000 40,000 40000 50,000 50000 60,000 60000<br />
Fast-Growing Markets<br />
France<br />
Austria<br />
Malaysia Germany Netherlands<br />
Argentina Finland<br />
Belgium<br />
Hong-Kong<br />
Italy Sweden<br />
Turkey<br />
Switzerland<br />
Taiwan<br />
Slovenia<br />
Slovakia SpainDK<br />
Ireland<br />
Poland NZ<br />
S. Africa<br />
Thailand<br />
Portugal<br />
Czech Japan<br />
Australia<br />
GDP per capita<br />
(in PPP USD, <strong>2012</strong>)<br />
Developed Markets<br />
Geography with<br />
strong market growth<br />
in value (CAGR<br />
<strong>2012</strong>-2017 > 5%)<br />
GDP per capita (log $)<br />
$2,000 $20,000 $100,000<br />
Fast-Growing Markets Developed Markets<br />
Fast-Growing Markets per capita GDP: +8% per year<br />
Middle class: from 26% (<strong>2012</strong>) to 59% (2030) of worldwide population<br />
Source: Worldbank, <strong>Essilor</strong> estimate, Estin & Co.<br />
<strong>2012</strong> <strong>Results</strong> 61