Train the Trainer Course book - Cochrane Public Health Group
Train the Trainer Course book - Cochrane Public Health Group
Train the Trainer Course book - Cochrane Public Health Group

You also want an ePaper? Increase the reach of your titles
YUMPU automatically turns print PDFs into web optimized ePapers that Google loves.
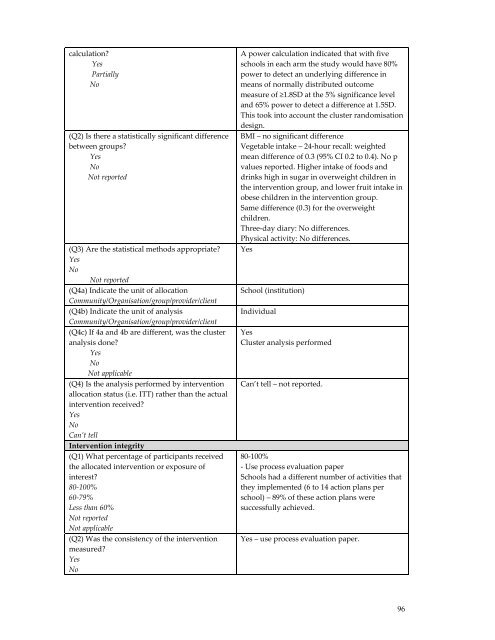
calculation?<br />
Yes<br />
Partially<br />
No<br />
(Q2) Is <strong>the</strong>re a statistically significant difference<br />
between groups?<br />
Yes<br />
No<br />
Not reported<br />
(Q3) Are <strong>the</strong> statistical methods appropriate?<br />
Yes<br />
No<br />
Not reported<br />
(Q4a) Indicate <strong>the</strong> unit of allocation<br />
Community/Organisation/group/provider/client<br />
(Q4b) Indicate <strong>the</strong> unit of analysis<br />
Community/Organisation/group/provider/client<br />
(Q4c) If 4a and 4b are different, was <strong>the</strong> cluster<br />
analysis done?<br />
Yes<br />
No<br />
Not applicable<br />
(Q4) Is <strong>the</strong> analysis performed by intervention<br />
allocation status (i.e. ITT) ra<strong>the</strong>r than <strong>the</strong> actual<br />
intervention received?<br />
Yes<br />
No<br />
Can’t tell<br />
Intervention integrity<br />
(Q1) What percentage of participants received<br />
<strong>the</strong> allocated intervention or exposure of<br />
interest?<br />
80-100%<br />
60-79%<br />
Less than 60%<br />
Not reported<br />
Not applicable<br />
(Q2) Was <strong>the</strong> consistency of <strong>the</strong> intervention<br />
measured?<br />
Yes<br />
No<br />
A power calculation indicated that with five<br />
schools in each arm <strong>the</strong> study would have 80%<br />
power to detect an underlying difference in<br />
means of normally distributed outcome<br />
measure of ≥1.8SD at <strong>the</strong> 5% significance level<br />
and 65% power to detect a difference at 1.5SD.<br />
This took into account <strong>the</strong> cluster randomisation<br />
design.<br />
BMI – no significant difference<br />
Vegetable intake – 24-hour recall: weighted<br />
mean difference of 0.3 (95% CI 0.2 to 0.4). No p<br />
values reported. Higher intake of foods and<br />
drinks high in sugar in overweight children in<br />
<strong>the</strong> intervention group, and lower fruit intake in<br />
obese children in <strong>the</strong> intervention group.<br />
Same difference (0.3) for <strong>the</strong> overweight<br />
children.<br />
Three-day diary: No differences.<br />
Physical activity: No differences.<br />
Yes<br />
School (institution)<br />
Individual<br />
Yes<br />
Cluster analysis performed<br />
Can’t tell – not reported.<br />
80-100%<br />
- Use process evaluation paper<br />
Schools had a different number of activities that<br />
<strong>the</strong>y implemented (6 to 14 action plans per<br />
school) – 89% of <strong>the</strong>se action plans were<br />
successfully achieved.<br />
Yes – use process evaluation paper.<br />
96