Cobram 2025 Cobram Strategy Plan - Moira Shire Council
Cobram 2025 Cobram Strategy Plan - Moira Shire Council
Cobram 2025 Cobram Strategy Plan - Moira Shire Council

You also want an ePaper? Increase the reach of your titles
YUMPU automatically turns print PDFs into web optimized ePapers that Google loves.
<strong>Cobram</strong> <strong>Strategy</strong> <strong>Plan</strong><br />
Final Report<br />
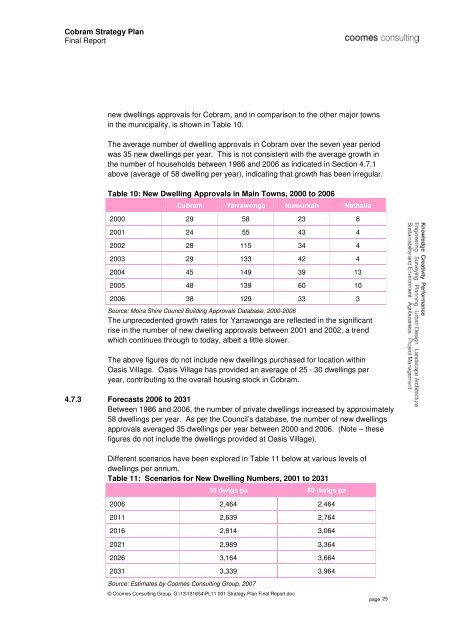
new dwellings approvals for <strong>Cobram</strong>, and in comparison to the other major towns<br />
in the municipality, is shown in Table 10.<br />
The average number of dwelling approvals in <strong>Cobram</strong> over the seven year period<br />
was 35 new dwellings per year. This is not consistent with the average growth in<br />
the number of households between 1986 and 2006 as indicated in Section 4.7.1<br />
above (average of 58 dwelling per year), indicating that growth has been irregular.<br />
Table 10: New Dwelling Approvals in Main Towns, 2000 to 2006<br />
<strong>Cobram</strong> Yarrawonga Numurkah Nathalia<br />
2000 29 58 23 8<br />
2001 24 55 43 4<br />
2002 28 115 34 4<br />
2003 29 133 42 4<br />
2004 45 149 39 13<br />
2005 48 139 60 10<br />
2006 38 129 33 3<br />
Source: <strong>Moira</strong> <strong>Shire</strong> <strong>Council</strong> Building Approvals Database, 2000-2006<br />
The unprecedented growth rates for Yarrawonga are reflected in the significant<br />
rise in the number of new dwelling approvals between 2001 and 2002, a trend<br />
which continues through to today, albeit a little slower.<br />
The above figures do not include new dwellings purchased for location within<br />
Oasis Village. Oasis Village has provided an average of 25 - 30 dwellings per<br />
year, contributing to the overall housing stock in <strong>Cobram</strong>.<br />
4.7.3 Forecasts 2006 to 2031<br />
Between 1986 and 2006, the number of private dwellings increased by approximately<br />
58 dwellings per year. As per the <strong>Council</strong>’s database, the number of new dwellings<br />
approvals averaged 35 dwellings per year between 2000 and 2006. (Note – these<br />
figures do not include the dwellings provided at Oasis Village).<br />
Different scenarios have been explored in Table 11 below at various levels of<br />
dwellings per annum.<br />
Table 11: Scenarios for New Dwelling Numbers, 2001 to 2031<br />
35 dwlgs pa 60 dwlgs pa<br />
2006 2,464 2,464<br />
2011 2,639 2,764<br />
2016 2,814 3,064<br />
2021 2,989 3,364<br />
2026 3,164 3,664<br />
2031 3,339 3,964<br />
Source: Estimates by Coomes Consulting Group, 2007<br />
© Coomes Consulting Group G:\13\131654\PL11 001 <strong>Strategy</strong> <strong>Plan</strong> Final Report.doc<br />
page 25