Full Report
Full Report
Full Report

Create successful ePaper yourself
Turn your PDF publications into a flip-book with our unique Google optimized e-Paper software.
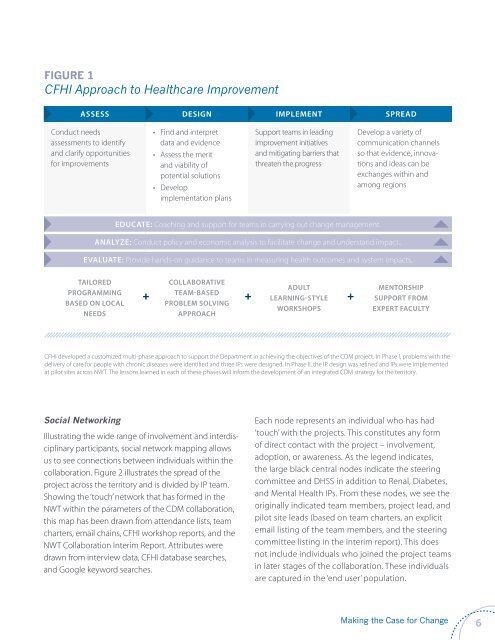
FIGURE 1<br />
CFHI Approach to Healthcare Improvement<br />
assess design implement spread<br />
Conduct needs<br />
assessments to identify<br />
and clarify opportunities<br />
for improvements<br />
• Find and interpret<br />
data and evidence<br />
• Assess the merit<br />
and viability of<br />
potential solutions<br />
• Develop<br />
implementation plans<br />
Support teams in leading<br />
improvement initiatives<br />
and mitigating barriers that<br />
threaten the progress<br />
Develop a variety of<br />
communication channels<br />
so that evidence, innovations<br />
and ideas can be<br />
exchanges within and<br />
among regions<br />
educate: Coaching and support for teams in carrying out change management.<br />
ANALYZE: Conduct policy and economic analysis to facilitate change and understand impact..<br />
EVALUATE: Provide hands-on guidance to teams in measuring health outcomes and system impacts.<br />
Tailored<br />
programming<br />
based on local<br />
needs<br />
Collaborative<br />
team-based<br />
problem solving<br />
approach<br />
Adult<br />
learning-style<br />
workshops<br />
+ + +<br />
Mentorship<br />
support from<br />
expert faculty<br />
CFHI developed a customized multi-phase approach to support the Department in achieving the objectives of the CDM project. In Phase I, problems with the<br />
delivery of care for people with chronic diseases were identified and three IPs were designed. In Phase II, the IP design was refined and IPs were implemented<br />
at pilot sites across NWT. The lessons learned in each of these phases will inform the development of an integrated CDM strategy for the territory.<br />
Social Networking<br />
Illustrating the wide range of involvement and interdisciplinary<br />
participants, social network mapping allows<br />
us to see connections between individuals within the<br />
collaboration. Figure 2 illustrates the spread of the<br />
project across the territory and is divided by IP team.<br />
Showing the ‘touch’ network that has formed in the<br />
NWT within the parameters of the CDM collaboration,<br />
this map has been drawn from attendance lists, team<br />
charters, email chains, CFHI workshop reports, and the<br />
NWT Collaboration Interim <strong>Report</strong>. Attributes were<br />
drawn from interview data, CFHI database searches,<br />
and Google keyword searches.<br />
Each node represents an individual who has had<br />
‘touch’ with the projects. This constitutes any form<br />
of direct contact with the project – involvement,<br />
adoption, or awareness. As the legend indicates,<br />
the large black central nodes indicate the steering<br />
committee and DHSS in addition to Renal, Diabetes,<br />
and Mental Health IPs. From these nodes, we see the<br />
originally indicated team members, project lead, and<br />
pilot site leads (based on team charters, an explicit<br />
email listing of the team members, and the steering<br />
committee listing in the interim report). This does<br />
not include individuals who joined the project teams<br />
in later stages of the collaboration. These individuals<br />
are captured in the ‘end user’ population.<br />
Making the Case for Change<br />
6