Proceedings of the meeting - Department of Physics - University of ...
Proceedings of the meeting - Department of Physics - University of ...
Proceedings of the meeting - Department of Physics - University of ...

You also want an ePaper? Increase the reach of your titles
YUMPU automatically turns print PDFs into web optimized ePapers that Google loves.
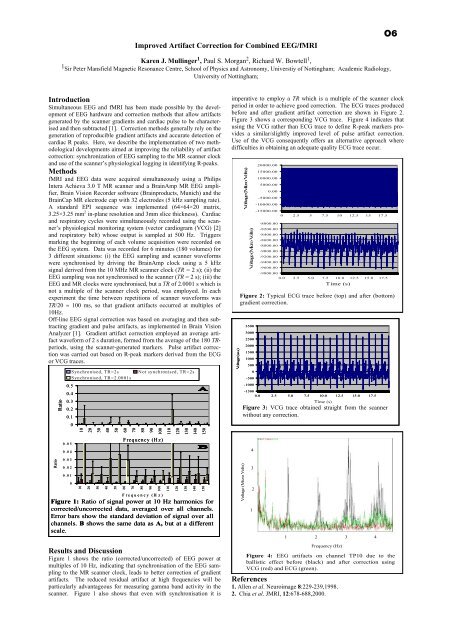
Improved Artifact Correction for Combined EEG/fMRIO6Karen J. Mullinger 1 , Paul S. Morgan 2 , Richard W. Bowtell 1 ,1 Sir Peter Mansfield Magnetic Resonance Centre, School <strong>of</strong> <strong>Physics</strong> and Astronomy, Universtiy <strong>of</strong> Nottingham; Academic Radiology,<strong>University</strong> <strong>of</strong> Nottingham;IntroductionSimultaneous EEG and fMRI has been made possible by <strong>the</strong> development<strong>of</strong> EEG hardware and correction methods that allow artifactsgenerated by <strong>the</strong> scanner gradients and cardiac pulse to be characterisedand <strong>the</strong>n subtracted [1]. Correction methods generally rely on <strong>the</strong>generation <strong>of</strong> reproducible gradient artifacts and accurate detection <strong>of</strong>cardiac R peaks. Here, we describe <strong>the</strong> implementation <strong>of</strong> two methodologicaldevelopments aimed at improving <strong>the</strong> reliability <strong>of</strong> artifactcorrection: synchronization <strong>of</strong> EEG sampling to <strong>the</strong> MR scanner clockand use <strong>of</strong> <strong>the</strong> scanner’s physiological logging in identifying R-peaks.MethodsfMRI and EEG data were acquired simultaneously using a PhilipsIntera Achieva 3.0 T MR scanner and a BrainAmp MR EEG amplifier,Brain Vision Recorder s<strong>of</strong>tware (Brainproducts, Munich) and <strong>the</strong>BrainCap MR electrode cap with 32 electrodes (5 kHz sampling rate).A standard EPI sequence was implemented (64×64×20 matrix,3.25×3.25 mm 2 in-plane resolution and 3mm slice thickness). Cardiacand respiratory cycles were simultaneously recorded using <strong>the</strong> scanner’sphysiological monitoring system (vector cardiogram (VCG) [2]and respiratory belt) whose output is sampled at 500 Hz. Triggersmarking <strong>the</strong> beginning <strong>of</strong> each volume acquisition were recorded on<strong>the</strong> EEG system. Data was recorded for 6 minutes (180 volumes) for3 different situations: (i) <strong>the</strong> EEG sampling and scanner waveformswere synchronised by driving <strong>the</strong> BrainAmp clock using a 5 kHzsignal derived from <strong>the</strong> 10 MHz MR scanner clock (TR = 2 s); (ii) <strong>the</strong>EEG sampling was not synchronised to <strong>the</strong> scanner (TR = 2 s); (iii) <strong>the</strong>EEG and MR clocks were synchronised, but a TR <strong>of</strong> 2.0001 s which isnot a multiple <strong>of</strong> <strong>the</strong> scanner clock period, was employed. In eachexperiment <strong>the</strong> time between repetitions <strong>of</strong> scanner waveforms wasTR/20 ≈ 100 ms, so that gradient artifacts occurred at multiples <strong>of</strong>10Hz.Off-line EEG signal correction was based on averaging and <strong>the</strong>n subtractinggradient and pulse artifacts, as implemented in Brain VisionAnalyzer [1]. Gradient artifact correction employed an average artifactwaveform <strong>of</strong> 2 s duration, formed from <strong>the</strong> average <strong>of</strong> <strong>the</strong> 180 TRperiods,using <strong>the</strong> scanner-generated markers. Pulse artifact correctionwas carried out based on R-peak markers derived from <strong>the</strong> ECGor VCG traces.RatioSynchronised, TR=2sSynchronised, TR=2.0001s0.50.40.30.20.100.050.04Not synchronised, TR=2s102030405060708090100110120130140150Frequency (Hz)imperative to employ a TR which is a multiple <strong>of</strong> <strong>the</strong> scanner clockperiod in order to achieve good correction. The ECG traces producedbefore and after gradient artifact correction are shown in Figure 2.Figure 3 shows a corresponding VCG trace. Figure 4 indicates thatusing <strong>the</strong> VCG ra<strong>the</strong>r than ECG trace to define R-peak markers providesa similar/slightly improved level <strong>of</strong> pulse artifact correction.Use <strong>of</strong> <strong>the</strong> VCG consequently <strong>of</strong>fers an alternative approach wheredifficulties in obtaining an adequate quality ECG trace occur.Voltage (a.u.)Voltage (Micro Volts)Voltage (Micro Volts)20000.0015000.0010000.005000.000.00-5000.00-10000.00-15000.000 2.5 5 7.5 10 12.5 15 17.5-8000.00-8200.00-8400.00-8600.00-8800.00-9000.00-9200.00-9400.00-9600.00-9800.000.0 2.5 5.0 7.5 10.0 12.5 15.0 17.5Time (s)Figure 2: Typical ECG trace before (top) and after (bottom)gradient correction.3500300025002000150010005000-500-1000-15000.0 2.5 5.0 7.5 10.0 12.5 15.0 17.5Time (s)Figure 3: VCG trace obtained straight from <strong>the</strong> scannerwithout any correction.4Ratio0.030.020.010102030405060708090100Frequency (H z)Figure 1: Ratio <strong>of</strong> signal power at 10 Hz harmonics forcorrected/uncorrected data, averaged over all channels.Error bars show <strong>the</strong> standard deviation <strong>of</strong> signal over allchannels. B shows <strong>the</strong> same data as A, but at a differentscale.110120130140150Voltage (Micro Volts)3211 2 34Results and DiscussionFigure 1 shows <strong>the</strong> ratio (corrected/uncorrected) <strong>of</strong> EEG power atmultiples <strong>of</strong> 10 Hz, indicating that synchronisation <strong>of</strong> <strong>the</strong> EEG samplingto <strong>the</strong> MR scanner clock, leads to better correction <strong>of</strong> gradientartifacts. The reduced residual artifact at high frequencies will beparticularly advantageous for measuring gamma band activity in <strong>the</strong>scanner. Figure 1 also shows that even with synchronisation it isFrequency (Hz)Figure 4: EEG artifacts on channel TP10 due to <strong>the</strong>ballistic effect before (black) and after correction usingVCG (red) and ECG (green).References1. Allen et al. Neuroimage 8:229-239,1998.2. Chia et al. JMRI, 12:678-688,2000.