Abnormal thalamic metabolism on H-MRS in ‘peripheral’ diabetic neuropathyO10ID Wilkinson 1 , D Selvarajah 2 , R Gandhi, N Woodhouse, C Emery, PD Griffiths, Tesfaye S1 Academic Radiology, <strong>University</strong> <strong>of</strong> Sheffield ; 2 Diabetes Unit, Royal Hallamshire Hospital, Glossop Road, Sheffield S10 2JFIntroductionDiabetic neuropathy (DN) is a common debilitatingcomplication <strong>of</strong> diabetes mellitus involving <strong>the</strong> extremities. Infact, diabetes is <strong>the</strong> leading cause <strong>of</strong> non-traumatic lower limbamputation in <strong>the</strong> western world. This particular complicationhas historically been classified as a disease <strong>of</strong> <strong>the</strong> peripheralnervous system and pathological abnormalities <strong>of</strong> <strong>the</strong>peripheral nerves in DN have been well quantified. Recentevidence from our group indicates spinal cord involvement inearly-stage DN (1). However, <strong>the</strong> extent <strong>of</strong> central nervoussystem involvement remains unresolved. A completeunderstanding <strong>of</strong> <strong>the</strong> full extent <strong>of</strong> nervous systeminvolvement is crucial to elucidating <strong>the</strong> pathogenesis <strong>of</strong> DNand may facilitate <strong>the</strong> development <strong>of</strong> novel, rationaletreatments. This study aims to extend our understanding <strong>of</strong>CNS involvement by investigating <strong>the</strong> metabolic status <strong>of</strong> <strong>the</strong>thalamus (common junction for most <strong>of</strong> <strong>the</strong> ascending sensorypathways) in DN using proton magnetic resonancespectroscopy (H-MRS).MethodsSixteen diabetic patients and 8 matched healthy volunteershave been studied. The diabetic patients consisted 2 groups: 8normal diabetics with no DN and 8 with establishedneuropathy determined according to published criteria (2).Spectra were obtained at 1.5T (Eclipse, Philips MedicalSystems, Best, The Ne<strong>the</strong>rlands) from an 8ml cubic voxelplaced over <strong>the</strong> right posterior lateral thalamic nucleus Twospectra were acquired per subject: one proton densityweighted(STimulated Echo Acquisition Mode - STEAMtechnique: TE=20ms, TR=3s) and <strong>the</strong> o<strong>the</strong>r T2-weighted(Point RESolved Spectroscopy - PRESS technique:TE=135ms, TR=1600ms). Short TE results are expressed asareas under <strong>the</strong> mI, Cho, Cr and NA resonances relative to thatfrom unsuppressed water. Long TE results are expressed as<strong>the</strong> ratios (NA/Cho, NA/Cr & Cho/Cr) <strong>of</strong> areas under <strong>the</strong> threemain peaks, Cho, Cr and NA.ResultsAt long TE, NA/Cho was lower in established DN comparedto diabetics without neuropathy (p=0.036) and healthycontrols (p=0.015) (fig 2). At short TE, no significant groupdifferences were apparent.Discussion & ConclusionsThe posterior lateral nucleus <strong>of</strong> <strong>the</strong> thalamus was chosen forspectroscopic examination because most ascending sensorypathways relay within this nucleus before projections are sentto higher cortical centres. If <strong>the</strong> observed variation resultsfrom reduced NA signal at long echo-time, this data suggestsaltered neuronal biochemistry in subjects with established DN.The lack <strong>of</strong> significant difference at short TE suggests that thismay be due to changes in metabolite T2. This data providesfur<strong>the</strong>r evidence that <strong>the</strong> CNS is involved in ‘peripheral’diabetic neuropathy.Figure 2: NA/Cho ratio obtained at long TE for <strong>the</strong> 3 groups.Figure 1: Example (a) spectroscopic ROI and long TE (135ms)spectra from (b) a normal control and (c) a diabetic subject wi<strong>the</strong>stablished neuropathyReferences1. Eaton SEM, Harris ND, Rajbhandari SM, Greenwood P,Wilkinson ID, Ward JD, Griffiths PD, Tesfaye S. Spinalcord atrophy in diabetic peripheral neuropathy. Lancet2001; 358:35-362. P.J. Dyck, J.L. Davies, W.J. Litchy, P.C. O’Brien. Longitudinalassessment <strong>of</strong> diabetic polyneuropathy using acomposite score in <strong>the</strong> Rochester Diabetic NeuropathyStudy cohort. Neurology(1997), 49, 229-239.
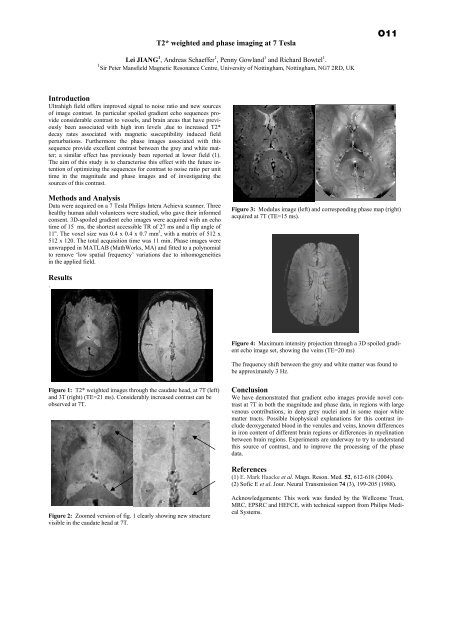
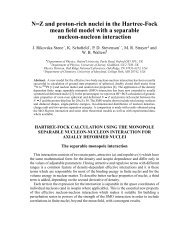
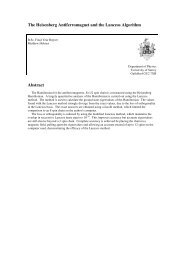
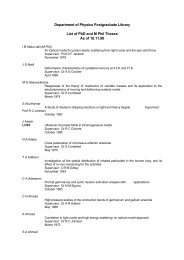
T2* weighted and phase imaging at 7 TeslaO11Lei JIANG 1 , Andreas Schaeffer 1 , Penny Gowland 1 and Richard Bowtel 1 .1 Sir Peter Mansfield Magnetic Resonance Centre, <strong>University</strong> <strong>of</strong> Nottingham, Nottingham, NG7 2RD, UKIntroductionUltrahigh field <strong>of</strong>fers improved signal to noise ratio and new sources<strong>of</strong> image contrast. In particular spoiled gradient echo sequences provideconsiderable contrast to vessels, and brain areas that have previouslybeen associated with high iron levels ,due to increased T2*decay rates associated with magnetic susceptibility induced fieldperturbations. Fur<strong>the</strong>rmore <strong>the</strong> phase images associated with thissequence provide excellent contrast between <strong>the</strong> grey and white matter;a similar effect has previously been reported at lower field (1).The aim <strong>of</strong> this study is to characterise this effect with <strong>the</strong> future intention<strong>of</strong> optimizing <strong>the</strong> sequences for contrast to noise ratio per unittime in <strong>the</strong> magnitude and phase images and <strong>of</strong> investigating <strong>the</strong>sources <strong>of</strong> this contrast.Methods and AnalysisData were acquired on a 7 Tesla Philips Intera Achieva scanner. Threehealthy human adult volunteers were studied, who gave <strong>the</strong>ir informedconsent. 3D-spoiled gradient echo images were acquired with an echotime <strong>of</strong> 15 ms, <strong>the</strong> shortest accessible TR <strong>of</strong> 27 ms and a flip angle <strong>of</strong>11 o . The voxel size was 0.4 x 0.4 x 0.7 mm 3 , with a matrix <strong>of</strong> 512 x512 x 120. The total acquisition time was 11 min. Phase images wereunwrapped in MATLAB (MathWorks, MA) and fitted to a polynomialto remove ‘low spatial frequency’ variations due to inhomogeneitiesin <strong>the</strong> applied field.Figure 3: Modulus image (left) and corresponding phase map (right)acquired at 7T (TE=15 ms).Results.Figure 4: Maximum intensity projection through a 3D spoiled gradientecho image set, showing <strong>the</strong> veins (TE=20 ms)The frequency shift between <strong>the</strong> grey and white matter was found tobe approximately 3 Hz.Figure 1: T2* weighted images through <strong>the</strong> caudate head, at 7T (left)and 3T (right) (TE=21 ms). Considerably increased contrast can beobserved at 7T.ConclusionWe have demonstrated that gradient echo images provide novel contrastat 7T in both <strong>the</strong> magnitude and phase data, in regions with largevenous contributions, in deep grey nuclei and in some major whitematter tracts. Possible biophysical explanations for this contrast includedeoxygenated blood in <strong>the</strong> venules and veins, known differencesin iron content <strong>of</strong> different brain regions or differences in myelinationbetween brain regions. Experiments are underway to try to understandthis source <strong>of</strong> contrast, and to improve <strong>the</strong> processing <strong>of</strong> <strong>the</strong> phasedata.References(1) E. Mark Haacke et al. Magn. Reson. Med. 52, 612-618 (2004).(2) S<strong>of</strong>ic E et al. Jour. Neural Transmission 74 (3), 199-205 (1988).Figure 2: Zoomed version <strong>of</strong> fig. 1 clearly showing new structurevisible in <strong>the</strong> caudate head at 7T.Acknowledgements: This work was funded by <strong>the</strong> Wellcome Trust,MRC, EPSRC and HEFCE, with technical support from Philips MedicalSystems.