Neighbourhood tractography: a new approach to seed point placement for group fibre trackingJonathan D. CLAYDEN 1 , Mark E. Bastin 2 , Amos J. Storkey 31 Neuroinformatics Doctoral Training Centre, School <strong>of</strong> Informatics;2 Medical and Radiological Sciences (Medical <strong>Physics</strong>);3 Institute for Adaptive and Neural Computation, School <strong>of</strong> Informatics; <strong>University</strong> <strong>of</strong> Edinburgh, Edinburgh, UKP34IntroductionOne area in which diffusion MRI (dMRI) based fibre trackingtechniques have strong potential is in <strong>the</strong> segmentation <strong>of</strong> individualwhite matter structures (tracts) from dMRI images. The segmentedareas can be used as regions <strong>of</strong> interest (ROIs) for studying tractspecific effects <strong>of</strong> pathology [1]. This kind <strong>of</strong> tractography basedsegmentation is advantageous over more established ROI methodsbecause <strong>the</strong> regions are calculated algorithmically, removing observersubjectivity; and because <strong>the</strong> regions can be arbitrarily shaped in threedimensions, matching <strong>the</strong> anatomy <strong>of</strong> <strong>the</strong> underlying fasciculus.However, fibre tracking algorithms typically require as input aseed point, a location in dMRI space from which <strong>the</strong> algorithm beginsto reconstruct a tract. The resultant segmentation can be very stronglydependent on <strong>the</strong> exact location <strong>of</strong> this point. This sensitivity can beproblematic when trying to consistently segment a specific tract fromseveral brain volumes. In this work we demonstrate <strong>the</strong> inconsistency<strong>of</strong> segmentations derived from registration based seed pointplacement, and describe an alternative approach that is based onmaximising output similarity to a reference tract within a seedingneighbourhood in native image space.MethodsData acquisition: Six normal volunteers (2 male, 4 female; mean age27 ± 3.4 years) were recruited for this study. Each subject underwent adMRI protocol on a GE Signa LX 1.5 T clinical scanner (GE MedicalSystems, Milwaukee, WI, USA). The protocol was a single-shot spinechoecho-planar imaging sequence with 51 noncollinear diffusionweighting gradient directions, at a b-value <strong>of</strong> 1000 s mm -2 , and 3 T2weighted scans. TR was 17 s per volume and TE was 94.3 ms.Registration based seed placement: We placed a seed point in <strong>the</strong>splenium <strong>of</strong> <strong>the</strong> corpus callosum in a standard (MNI) brain volume,and transferred it to each subject’s native dMRI space using <strong>the</strong>FLIRT registration tool (FMRIB, Oxford, UK), with <strong>the</strong> MNI whitematter map as a weighting mask [2]. The BEDPOST/ProbTrack fibretracking algorithm [3] was <strong>the</strong>n seeded at <strong>the</strong>se locations in each brainvolume. This algorithm models one fibre direction per voxel.Neighbourhood tractography: One <strong>of</strong> <strong>the</strong> tracts produced by <strong>the</strong>registration based seeding method described above was chosen as <strong>the</strong>reference tract for <strong>the</strong> purposes <strong>of</strong> this study. For every o<strong>the</strong>r brainvolume, <strong>the</strong> BEDPOST/ProbTrack algorithm was <strong>the</strong>n seeded at everyvoxel location within a 7x7x7 voxel neighbourhood centred at <strong>the</strong>seed point chosen by registration. The similarity <strong>of</strong> each <strong>of</strong> <strong>the</strong>se“candidate” tracts to <strong>the</strong> reference tract was <strong>the</strong>n calculated using atract similarity measure that we have developed and previouslydescribed [4], and only <strong>the</strong> tract with <strong>the</strong> greatest similarity wasretained. The associated seed point is thus <strong>the</strong> best match to <strong>the</strong>reference tract seed point, based on <strong>the</strong> evidence <strong>of</strong> output similarity.ResultsFig. 1 shows axial projections <strong>of</strong> <strong>the</strong> tracts produced by applyingregistration based seed placement to one brain volume from eachsubject. The tract output is probabilistic, with red indicating areas <strong>of</strong>low likelihood <strong>of</strong> connection to <strong>the</strong> seed point, and yellow indicatinghigh likelihood. Fig. 2 shows <strong>the</strong> equivalent projections for <strong>the</strong> tractschosen as most similar to <strong>the</strong> reference tract (a), within <strong>the</strong> seedingneighbourhood. In both figures, all tract data have been thresholded at<strong>the</strong> 1% level to ignore areas <strong>of</strong> very low connection likelihood; and<strong>the</strong> underlying greyscale images show <strong>the</strong> slice <strong>of</strong> <strong>the</strong> subject’sanisotropy map in plane with <strong>the</strong> seed point.DiscussionThere is a general improvement in consistency, in terms <strong>of</strong> tract shape,in <strong>the</strong> neighbourhood tractography results shown here, relative to <strong>the</strong>results from a purely registration based seeding process. Fig. 2(b) and2(c) are clearly better matches to 2(a) than <strong>the</strong>ir equivalents in Fig. 1,while <strong>the</strong> remaining tracts at least do not represent worse matches. Itshould be noted that in any given seeding neighbourhood, <strong>the</strong>re is noguarantee that a good match to <strong>the</strong> reference tract will be available. Inaddition, <strong>the</strong> efficacy <strong>of</strong> neighbourhood tractography will depend on<strong>the</strong> capabilities <strong>of</strong> both <strong>the</strong> fibre tracking algorithm and <strong>the</strong> similaritymeasure being used.Figure 1: Tract output produced by using registration to place seeds.Figure 2: Tract output chosen by <strong>the</strong> neighbourhood tractographymethod, using (a) as <strong>the</strong> reference tract.ConclusionNeighbourhood tractography is a novel approach to an importantproblem in group fibre tracking—that <strong>of</strong> consistent tract segmentation.It nei<strong>the</strong>r manipulates <strong>the</strong> dMRI data nor constrains <strong>the</strong> fibre trackingalgorithm, instead simply providing a preference for seed points thatproduce tracts with high shape and length similarity [4] to a referencetract. Whilst for <strong>the</strong> purposes <strong>of</strong> this study <strong>the</strong> reference tract wastaken from our dataset, in general it would be preferable to work froma standard set <strong>of</strong> reference tracts, and we would advocate <strong>the</strong> creation<strong>of</strong> such a set. We believe that this technique could have considerablepromise, particularly as similarity measures are refined.References[1] Kanaan et al. (2006). Psych Res: Neuroimaging 146(1):73–82.[2] Clayden et al. (2005). Proc ESMRMB 22, number 508.[3] Behrens et al. (2003). Magn Reson Med 50(5):1077–1088.[4] Clayden et al. (2006). Proc ISMRM 14, number 2742.
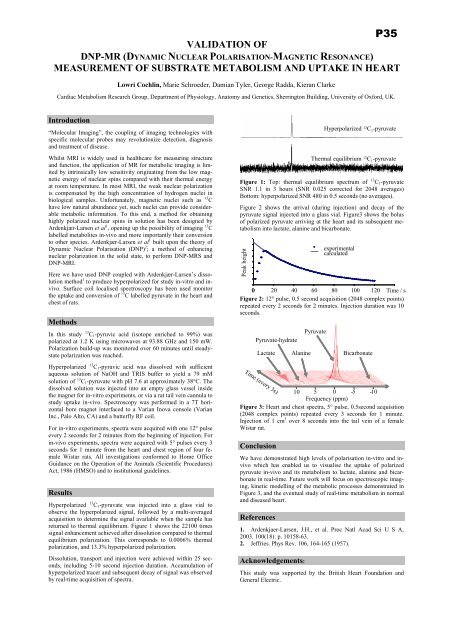
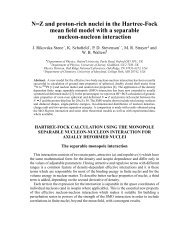
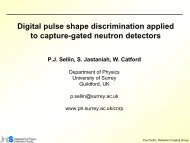
P35VALIDATION OFDNP-MR (DYNAMIC NUCLEAR POLARISATION-MAGNETIC RESONANCE)MEASUREMENT OF SUBSTRATE METABOLISM AND UPTAKE IN HEARTLowri Cochlin, Marie Schroeder, Damian Tyler, George Radda, Kieran ClarkeCardiac Metabolism Research Group, <strong>Department</strong> <strong>of</strong> Physiology, Anatomy and Genetics, Sherrington Building, <strong>University</strong> <strong>of</strong> Oxford, UK.Introduction“Molecular Imaging”, <strong>the</strong> coupling <strong>of</strong> imaging technologies withspecific molecular probes may revolutionize detection, diagnosisand treatment <strong>of</strong> disease.Whilst MRI is widely used in healthcare for measuring structureand function, <strong>the</strong> application <strong>of</strong> MR for metabolic imaging is limitedby intrinsically low sensitivity originating from <strong>the</strong> low magneticenergy <strong>of</strong> nuclear spins compared with <strong>the</strong>ir <strong>the</strong>rmal energyat room temperature. In most MRI, <strong>the</strong> weak nuclear polarizationis compensated by <strong>the</strong> high concentration <strong>of</strong> hydrogen nuclei inbiological samples. Unfortunately, magnetic nuclei such as 13 Chave low natural abundance yet, such nuclei can provide considerablemetabolic information. To this end, a method for obtaininghighly polarized nuclear spins in solution has been designed byArdenkjær-Larsen et al 1 , opening up <strong>the</strong> possibility <strong>of</strong> imaging 13 Clabelled metabolites in-vivo and more importantly <strong>the</strong>ir conversionto o<strong>the</strong>r species. Ardenkjær-Larsen et al 1 built upon <strong>the</strong> <strong>the</strong>ory <strong>of</strong>Dynamic Nuclear Polarisation (DNP) 2 ; a method <strong>of</strong> enhancingnuclear polarization in <strong>the</strong> solid state, to perform DNP-MRS andDNP-MRI.Here we have used DNP coupled with Ardenkjær-Larsen’s dissolutionmethod 1 to produce hyperpolarized for study in-vitro and invivo.Surface coil localised spectroscopy has been used monitor<strong>the</strong> uptake and conversion <strong>of</strong> 13 C labelled pyruvate in <strong>the</strong> heart andchest <strong>of</strong> rats.MethodsIn this study 13 C 1 -pyruvic acid (isotope enriched to 99%) waspolarized at 1.2 K using microwaves at 93.88 GHz and 150 mW.Polarization build-up was monitored over 60 minutes until steadystatepolarization was reached.Hyperpolarized 13 C 1 -pyruvic acid was dissolved with sufficientaqueous solution <strong>of</strong> NaOH and TRIS buffer to yield a 79 mMsolution <strong>of</strong> 13 C 1 -pyruvate with pH 7.6 at approximately 38°C. Thedissolved solution was injected into an empty glass vessel inside<strong>the</strong> magnet for in-vitro experiments, or via a rat tail vein cannula tostudy uptake in-vivo. Spectroscopy was performed in a 7T horizontalbore magnet interfaced to a Varian Inova console (VarianInc., Palo Alto, CA) and a butterfly RF coil.For in-vitro experiments, spectra were acquired with one 12° pulseevery 2 seconds for 2 minutes from <strong>the</strong> beginning <strong>of</strong> injection. Forin-vivo experiments, spectra were acquired with 5° pulses every 3seconds for 1 minute from <strong>the</strong> heart and chest region <strong>of</strong> four femaleWistar rats. All investigations conformed to Home OfficeGuidance on <strong>the</strong> Operation <strong>of</strong> <strong>the</strong> Animals (Scientific Procedures)Act, 1986 (HMSO) and to institutional guidelines.ResultsHyperpolarized 13 C 1 -pyruvate was injected into a glass vial toobserve <strong>the</strong> hyperpolarized signal, followed by a multi-averagedacquisition to determine <strong>the</strong> signal available when <strong>the</strong> sample hasreturned to <strong>the</strong>rmal equilibrium. Figure 1 shows <strong>the</strong> 22100 timessignal enhancement achieved after dissolution compared to <strong>the</strong>rmalequilibrium polarization. This corresponds to 0.0006% <strong>the</strong>rmalpolarization, and 13.3% hyperpolarized polarization.Dissolution, transport and injection were achieved within 25 seconds,including 5-10 second injection duration. Accumulation <strong>of</strong>hyperpolarized tracer and subsequent decay <strong>of</strong> signal was observedby real-time acquisition <strong>of</strong> spectra.Hyperpolarized 13 C 1-pyruvateThermal equilibrium 13 C 1-pyruvateFigure 1: Top: <strong>the</strong>rmal equilibrium spectrum <strong>of</strong> 13 C 1 -pyruvateSNR 1.1 in 3 hours (SNR 0.025 corrected for 2048 averages)Bottom: hyperpolarized SNR 480 in 0.5 seconds (no averages).Figure 2 shows <strong>the</strong> arrival (during injection) and decay <strong>of</strong> <strong>the</strong>pyruvate signal injected into a glass vial. Figure3 shows <strong>the</strong> bolus<strong>of</strong> polarized pyruvate arriving at <strong>the</strong> heart and its subsequent metabolisminto lactate, alanine and bicarbonate.Peak heightexperimentalcalculated0 20 40 60 80 100 120 Time / sFigure 2: 12° pulse, 0.5 second acquisition (2048 complex points)repeated every 2 seconds for 2 minutes. Injection duration was 10seconds.Pyruvate-hydrateLactateTime (every 3s)AlaninePyruvateBicarbonate10 5 0 -5 -10Frequency (ppm)Figure 3: Heart and chest spectra, 5° pulse, 0.5second acquisition(2048 complex points) repeated every 3 seconds for 1 minute.Injection <strong>of</strong> 1 cm 3 over 8 seconds into <strong>the</strong> tail vein <strong>of</strong> a femaleWistar rat.ConclusionWe have demonstrated high levels <strong>of</strong> polarisation in-vitro and invivowhich has enabled us to visualise <strong>the</strong> uptake <strong>of</strong> polarizedpyruvate in-vivo and its metabolism to lactate, alanine and bicarbonatein real-time. Future work will focus on spectroscopic imaging,kinetic modelling <strong>of</strong> <strong>the</strong> metabolic processes demonstrated inFigure 3, and <strong>the</strong> eventual study <strong>of</strong> real-time metabolism in normaland diseased heart.References1. Ardenkjaer-Larsen, J.H., et al. Proc Natl Acad Sci U S A,2003. 100(18): p. 10158-63.2. Jeffries. Phys Rev. 106, 164-165 (1957).Acknowledgements:This study was supported by <strong>the</strong> British Heart Foundation andGeneral Electric.