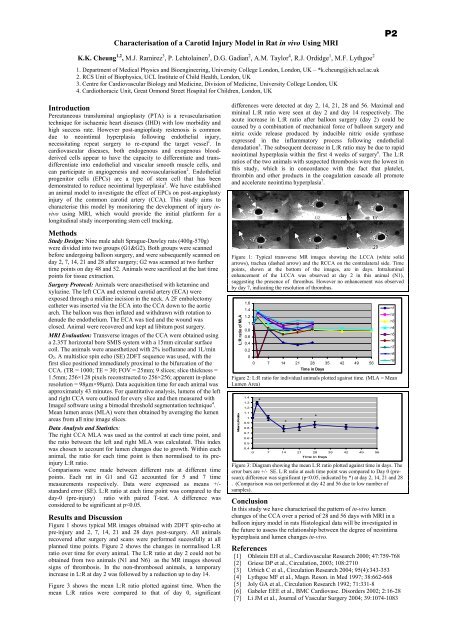
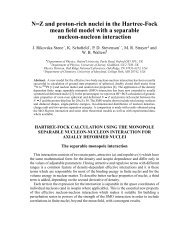
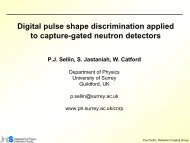
Characterisation <strong>of</strong> a Carotid Injury Model in Rat in vivo Using MRIP2K.K. Cheung 1,2 , M.J. Ramirez 3 , P. Lehtolainen 3 , D.G. Gadian 2 , A.M. Taylor 4 , R.J. Ordidge 1 , M.F. Lythgoe 21. <strong>Department</strong> <strong>of</strong> Medical <strong>Physics</strong> and Bioengineering, <strong>University</strong> College London, London, UK – *k.cheung@ich.ucl.ac.uk2. RCS Unit <strong>of</strong> Biophysics, UCL Institute <strong>of</strong> Child Health, London, UK3. Centre for Cardiovascular Biology and Medicine, Division <strong>of</strong> Medicine, <strong>University</strong> College London, UK4. Cardiothoracic Unit, Great Ormond Street Hospital for Children, London, UKIntroductionPercutaneous transluminal angioplasty (PTA) is a revascularisationtechnique for ischaemic heart diseases (IHD) with low morbidity andhigh success rate. However post-angioplasty restenosis is commondue to neointimal hyperplasia following endo<strong>the</strong>lial injury,necessitating repeat surgery to re-expand <strong>the</strong> target vessel 1 . Incardiovascular diseases, both endogenous and exogenous bloodderivedcells appear to have <strong>the</strong> capacity to differentiate and transdifferentiateinto endo<strong>the</strong>lial and vascular smooth muscle cells, andcan participate in angiogenesis and neovascularisation 2 . Endo<strong>the</strong>lialprogenitor cells (EPCs) are a type <strong>of</strong> stem cell that has beendemonstrated to reduce neointimal hyperplasia 3 . We have establishedan animal model to investigate <strong>the</strong> effect <strong>of</strong> EPCs on post-angioplastyinjury <strong>of</strong> <strong>the</strong> common carotid artery (CCA). This study aims tocharacterise this model by monitoring <strong>the</strong> development <strong>of</strong> injury invivousing MRI, which would provide <strong>the</strong> initial platform for alongitudinal study incorporating stem cell tracking.MethodsStudy Design: Nine male adult Sprague-Dawley rats (400g-570g)were divided into two groups (G1&G2). Both groups were scannedbefore undergoing balloon surgery, and were subsequently scanned onday 2, 7, 14, 21 and 28 after surgery; G2 was scanned at two fur<strong>the</strong>rtime points on day 48 and 52. Animals were sacrificed at <strong>the</strong> last timepoints for tissue extraction.Surgery Protocol: Animals were anaes<strong>the</strong>tised with ketamine andxylazine. The left CCA and external carotid artery (ECA) wereexposed through a midline incision in <strong>the</strong> neck. A 2F embolectomyca<strong>the</strong>ter was inserted via <strong>the</strong> ECA into <strong>the</strong> CCA down to <strong>the</strong> aorticarch. The balloon was <strong>the</strong>n inflated and withdrawn with rotation todenude <strong>the</strong> endo<strong>the</strong>lium. The ECA was tied and <strong>the</strong> wound wasclosed. Animal were recovered and kept ad libitum post surgery.MRI Evaluation: Transverse images <strong>of</strong> <strong>the</strong> CCA were obtained usinga 2.35T horizontal bore SMIS system with a 15mm circular surfacecoil. The animals were anaes<strong>the</strong>tized with 2% is<strong>of</strong>lurane and 1L/minO 2 . A multislice spin echo (SE) 2DFT sequence was used, with <strong>the</strong>first slice positioned immediately proximal to <strong>the</strong> bifurcation <strong>of</strong> <strong>the</strong>CCA. (TR = 1000; TE = 30; FOV = 25mm; 9 slices; slice thickness =1.5mm; 256×128 pixels reconstructed to 256×256; apparent in-planeresolution = 98µm×98µm). Data acquisition time for each animal wasapproximately 43 minutes. For quantitative analysis, lumens <strong>of</strong> <strong>the</strong> leftand right CCA were outlined for every slice and <strong>the</strong>n measured withImageJ s<strong>of</strong>tware using a bimodal threshold segmentation technique 4 .Mean lumen areas (MLA) were <strong>the</strong>n obtained by averaging <strong>the</strong> lumenareas from all nine image slices.Data Analysis and Statistics:The right CCA MLA was used as <strong>the</strong> control at each time point, and<strong>the</strong> ratio between <strong>the</strong> left and right MLA was calculated. This indexwas chosen to account for lumen changes due to growth. Within eachanimal, <strong>the</strong> ratio for each time point is <strong>the</strong>n normalised to its preinjuryL:R ratio.Comparisons were made between different rats at different timepoints. Each rat in G1 and G2 accounted for 5 and 7 timemeasurements respectively. Data were expressed as means +/-standard error (SE). L:R ratio at each time point was compared to <strong>the</strong>day-0 (pre-injury) ratio with paired T-test. A difference wasconsidered to be significant at p
A Locally Adaptive Gradient Controlled Spatial Regularisation Partial Volume ClassifierP3John P. Chiverton, Kevin Wells,1 Centre for Vision, Speech and Signal Processing, School <strong>of</strong> Electronics and Physical Sciences,<strong>University</strong> <strong>of</strong> Surrey, GU2 7XH, UKIntroductionMR imaging <strong>of</strong> <strong>the</strong> human brain is an important imaging modality inclinical and research applications <strong>of</strong> neurology. The accuratequantitation <strong>of</strong> <strong>the</strong> gross anatomical tissues, i.e. Grey Matter (GM)and White Matter (WM) is an important step in many diagnosticapplications. Unfortunately MR images suffer from imaging artefacts,notably <strong>the</strong> Partial Volume (PV) effect where individual voxels maybe composed <strong>of</strong> a mixture <strong>of</strong> <strong>the</strong>se tissues. This work presents a novelmethodology, utilising a locally adaptive Gradient-controlled SpatialRegulariser (GSR) in a Bayesian formulation for <strong>the</strong> quantification <strong>of</strong><strong>the</strong>se tissues in <strong>the</strong> presence <strong>of</strong> <strong>the</strong> PV effect. This new formulationresults in competitive and in some instances superior PV classifierperformance in comparison with o<strong>the</strong>r existing classifiers, due to <strong>the</strong>adaptive spatial regularisation.MethodsThe PV effect is modelled here by utilising a Bayesian formulation.The per voxel tissue content is modelled as a mixture random vector,α = (α 1 α 2 ... α n ) T for n tissues. Each vector element, α i , isrepresentative <strong>of</strong> <strong>the</strong> amount <strong>of</strong> tissue in <strong>the</strong> voxel, where 0 representszero content and 1 represents full content. The probability density forthis random vector given a voxel intensity, g, gradient magnitude, z,and <strong>the</strong> mean mixture vector, α N , <strong>of</strong> <strong>the</strong> neighbouring voxels is givenby <strong>the</strong> posterior density via Bayes <strong>the</strong>orem:p( α | g, α N ,θ,z) ∝ p( g | α,θ) . p( α | α N ,z)(2)where <strong>the</strong> first term on <strong>the</strong> r.h.s. is <strong>the</strong> intensity likelihood and in thiscase a Gaussian distribution (given a particular mixture vector) is mostappropriate for neurological MR magnitude data, see [1]. Theparameters <strong>of</strong> <strong>the</strong> Gaussian distribution are described by θ containingmeans and standard deviations. The right most term is <strong>the</strong> locallydefined spatial mixing prior dependent on <strong>the</strong> neighbouring mixturevalues and <strong>the</strong> gradient magnitude. The form <strong>of</strong> this spatial mixingprior will now be discussed.A quadratic function is useful to measure <strong>the</strong> dissimilarity between<strong>the</strong> voxel’s mixing vector, α, and <strong>the</strong> mean mixing vector <strong>of</strong>neighbouring voxels, α N , <strong>the</strong> result <strong>of</strong> which is a Gaussian distributedrandom variable. This was previously found by Choi et al, 1993 [2].We however have also found a functional relationship exists between<strong>the</strong> locally calculated image gradient magnitude, z, and <strong>the</strong> standarddeviation <strong>of</strong> this distribution, i.e. <strong>the</strong> amount <strong>of</strong> spatial regularisationrequired. This relationship allows <strong>the</strong> spatial regularisation <strong>of</strong> <strong>the</strong>mixing prior to be regulated on a per voxel basis. Thus regions <strong>of</strong> highgradient magnitude require less spatial regularisation due to <strong>the</strong> likelydissimilarity <strong>of</strong> <strong>the</strong> neighbouring voxel tissue content. We found <strong>the</strong>functional relationship to be well modelled by a Beta density function.Parameter estimation was undertaken by simulating <strong>the</strong>conditional posterior densities with an Independent MetropolisHastings (IMH) Markov Chain Monte Carlo (MCMC) approach. Themean and variance prior distributions were given Gaussian andGamma PDFs respectively and were used as <strong>the</strong> proposal distributionsin <strong>the</strong> IMH algorithm to simulate <strong>the</strong> posterior distributions <strong>of</strong> <strong>the</strong>mean and variance parameters. The aforementioned constraints on <strong>the</strong>mixing parameter vector prevent <strong>the</strong> spatial prior mixing distributionfrom being <strong>the</strong> proposal distribution in <strong>the</strong> simulation <strong>of</strong> <strong>the</strong> mixingvectors. Therefore, a Dirichlet density was selected as <strong>the</strong> mixingvectors’ proposal distribution. This density fulfils <strong>the</strong> mixingconstraints whilst matching <strong>the</strong> approximate form <strong>of</strong> <strong>the</strong>oreticalmixing densities previously found in [3].Performance assessment was undertaken with publicly availabledata sets: (1) Simulated MR brain data from <strong>the</strong> Brain Imaging Center,Montreal Neurological Institute, Canada [4]; (2) 20 normal MR braindata sets and <strong>the</strong>ir manual segmentations from <strong>the</strong> Center forMorphometric Analysis at Massachusetts General Hospital, USA, [5],with variable image quality due to <strong>the</strong> PV effect and o<strong>the</strong>r imagingartefacts such as intensity inhomogeneities. The simulated MR braindata also provides PV ground truth values while <strong>the</strong> 20 normal MRIdata sets have expert discrete voxel manual segmentations, i.e. no PVground truth. Therefore <strong>the</strong> voxel RMS error metric was used on <strong>the</strong>simulated MR brain data sets while <strong>the</strong> discrete metric known as <strong>the</strong>Jaccard similarity measure was used for <strong>the</strong> 20 normal MRI braindata sets. The Jaccard metric measures <strong>the</strong> amount <strong>of</strong> ‘overlap’between <strong>the</strong> classifier output and <strong>the</strong> ground truth where 1.0 is perfectand 0.0 is not segmented at all.ResultsAfter applying <strong>the</strong> GSR classifier to <strong>the</strong> simulated MR brain data with3% noise, we found <strong>the</strong> classified voxel RMS values were 12% and9% for GM and WM respectively. This compares to RMS values in[6] using three fuzzy clustering techniques: 14%, 15%, 12% for GMvoxels and 13%, 11%, 11% for WM voxels. 5%, 7% and 9% noisedata sets were also classified with results given in table 1 toge<strong>the</strong>rwith alternative PV classifiers from [7] which are Maximum aposteriori (SMAP) and Maximum Likelihood (SML) techniques thatmodel <strong>the</strong> PV voxels as coming from separate classification classes.The results in table 1 illustrate <strong>the</strong> superior performance (<strong>of</strong> GSR) for<strong>the</strong> majority <strong>of</strong> <strong>the</strong> classified PV voxels. GSR classified GM and WMimage slices for <strong>the</strong> simulated brain data with <strong>the</strong> most noise (9%) canbe seen in fig. 1. Visual comparison with <strong>the</strong> ground truth (also infig.1) illustrates <strong>the</strong> similarity between <strong>the</strong> ground truth and <strong>the</strong> output<strong>of</strong> GSR.Table 1: RMS PV classifier errors for <strong>the</strong> simulated MRI brain data sets withnoise <strong>of</strong> 3 – 9%. SMAP, SML are PV classifiers in [7].Figure 1: GSR classifier output (WM-a GM-b) and PV ground truth maps(WM-c,GM-d) for 9% noise simulated MRI brain data.The results <strong>of</strong> applying GSR on <strong>the</strong> 20 real MRI data sets alsoproduced promising results with mean Jaccard similarities: 0.57 forWM voxels and 0.58 for GM voxels. A Jaccard value <strong>of</strong> 1 is optimum,although human expert segmenters only achieve between 0.8 and 0.9,[5,8]. GSR does not include any modelling <strong>of</strong> <strong>the</strong> prominent intensityinhomogeneities present in most <strong>of</strong> <strong>the</strong> data sets and could beimproved significantly with additional model refinements. Thesevalues can be compared with a number <strong>of</strong> standard baseline classifierswhose Jaccard similarity results in [5,8] are: 0.57, 0.56, 0.57, 0.55,0.55, 0.57 for <strong>the</strong> WM voxels and 0.56, 0.56, 0.47, 0.55, 0.54, 0.48 for<strong>the</strong> GM voxels.ConclusionThis short abstract has briefly described a novel per voxel gradientcontrolled and adaptive spatially regulated Bayesian formulation forPV classification <strong>of</strong> MR image data. Classifier performanceassessment has been undertaken and <strong>the</strong> results have been found to becompetitive and in some cases superior to o<strong>the</strong>r high performanceclassifiers in <strong>the</strong> medical image analysis literature. Fur<strong>the</strong>r work willinclude modelling <strong>of</strong> intensity inhomogeneities and o<strong>the</strong>r imagingartefacts, to fur<strong>the</strong>r improve <strong>the</strong> classification rate.Acknowledgements The authors gratefully acknowledge <strong>the</strong> Center forMorphometric Analysis at Massachusetts General Hospital and <strong>the</strong> BrainImaging Center, Montreal Neurological Institute for <strong>the</strong> availability <strong>of</strong> <strong>the</strong> datasets. This work was supported by UK EPSRC.References(1) Gudbjartsson H, Patz S. Magn. Reson. Med. 34, 910-914 (1995)(2) Choi, HS et al. IEEE Trans. Med. Imag. 10, 395-407 (1991)(3) Chiverton J, Wells K, IEEE Sig Proc Letters, 13, 369-372 (2006)(4) Kwan R et al, Lecture Notes in Comp. Sci. 1131, 135-140, (1996)(5) available online: http://www.cma.mgh.hardvard.edu/ibsr/(6) Pham DL, Prince J, In Proc. IEEE MMBIA, 170-177, (2000)(7) Shattuck DW et al Neuroimage 13, 856-876 (2001)(8) Rajapakse JC, Kruggel F, Image Vis. Comp. 16, 165-180, (1998)