P15Using <strong>the</strong> blood oxygen level dependant magnetic resonance signal to observe <strong>the</strong> neuronal effects <strong>of</strong>acute and chronic fluoxetine administration in <strong>the</strong> mammalian brainTamsin Langley 1 , Steven C.R. Williams 1 , Michael O’Neill 2 and Nicholas Jones 11 Institute <strong>of</strong> Psychiatry, London, U.K. 2 Eli Lilly & Co. Surrey, U.K.IntroductionPrevious research has indicated that chronic but not acute dosing <strong>of</strong>SSRIs is required to confer a full clinical effect 1 . The initial inhibition<strong>of</strong> <strong>the</strong> 5HT 1A autoreceptor following acute SSRI treatment and itssubsequent gradual disinhibition following chronic administration hasbeen proposed to be inherent in this slow <strong>the</strong>rapeutic onset, known as<strong>the</strong> ‘clinical lag phase’ 2 . Pre-clinical studies using various invasiveneuroimaging techniques such as microdialysis 3 , electrophysiology 2and autoradiography 4 have shown reduced neurotransmission within<strong>the</strong> serotonergic system, as well as reduced 5HT concentrations inspecific brain regions during this time period. In this study, we used<strong>the</strong> non-invasive in vivo imaging technique, pharmacological magneticresonance imaging 5 (phMRI) to examine <strong>the</strong> effects <strong>of</strong> acute andchronic dosing <strong>of</strong> fluoxetine on neuronal activation in <strong>the</strong> rat.MethodsThe acute study consisted <strong>of</strong> Sprague Dawley (S.D.) rats (n=9) beinganaes<strong>the</strong>tised and placed in a 4.7 T superconducting magnet beforereceiving an intraperitoneal (ip) dose <strong>of</strong> ei<strong>the</strong>r vehicle or fluoxetine.The chronic study consisted <strong>of</strong> S.D. rats (n=9) receiving ei<strong>the</strong>r vehicleor fluoxetine 10mg/kg orally (p.o.) for 20 days. On day 21 <strong>of</strong> chronicdosing, subjects were placed into <strong>the</strong> same magnet and <strong>the</strong> protocolfor <strong>the</strong> acute study was followed. For both studies subjects werescanned using a continuous, three echo, gradient echo sequence (TE=5,10,15 ms; TR =940 ms; acquisition matrix= 64x64x24; FOV=4cm 2 ;voxel resolution <strong>of</strong> 0.5x0.5x0.5mm).Whole brain volumes wereacquired for each subject every minute for 180 minutes. Following preprocessing <strong>of</strong> <strong>the</strong>se volumes, SPM 99 was used to analyse <strong>the</strong> data andidentify alterations in BOLD contrast. This study was conducted inaccordance with <strong>the</strong> Animals (Experimental Procedures) Act (1986)and local ethical requirementsResultsPhMRI was sensitive to antidepressant action in <strong>the</strong> rat brain. Significantalterations in BOLD contrast were observed following both acuteand chronic fluoxetine. Acute treatment produced significant increasesin BOLD contrast in <strong>the</strong> hypothalamus and significant decreases inbrain regions including <strong>the</strong> pre-frontal cortex and dorsal and medianraphe nucleus (figure 1 a&b). Chronic treatment produced <strong>the</strong> oppositeeffect; significant increases in BOLD contrast within <strong>the</strong> dorsaland raphe nucleus and decreases in <strong>the</strong> hypothalamic region (figure 2a&b) Therefore a distinct spatio-temporal difference was identifiedwithin brain regions following acute and chronic dosing.abaFigure 2: The effect <strong>of</strong> chronic fluoxetine dosing. SPM {t}distribution maps <strong>of</strong> BOLD signal change overlaid onto co-registeredspin echo anatomical templates, a) shows <strong>the</strong> results for <strong>the</strong> vehiclegroup, b) shows <strong>the</strong> results for <strong>the</strong> drug group. Coloured pixelsrepresent significant correlation (thresholded at p < 0.05 corrected formultiple comparisons, T > 4.28) <strong>of</strong> signal time course withpharmacokinetic pr<strong>of</strong>ile <strong>of</strong> fluoxetine. Red = positive correlation, blue= negative correlation, vehicle group n=10 drug group n=7.ConclusionsPhMRI can successfully identify a distinct change between an acuteand a more clinically relevant chronic dose <strong>of</strong> <strong>the</strong> SSRI fluoxetine.This study concurs with findings from laboratories employinginvasive neuroimaging techniques. It fur<strong>the</strong>r supports <strong>the</strong> <strong>the</strong>ory thathypothalamic and mesencephalic nuclei regions are integral inserotonergic neurotransmission 6 and <strong>the</strong> gradual desensitization <strong>of</strong> <strong>the</strong>5HT 1A autoreceptor in <strong>the</strong> dorsal raphe nucleus contributes to <strong>the</strong> slowonset <strong>of</strong> <strong>the</strong>rapeutic activity observed in SSRIs. This in vivoneuroimaging tool enables <strong>the</strong> direct translation from <strong>the</strong> pre-clinicalto clinical setting and may expedite <strong>the</strong> development <strong>of</strong> <strong>the</strong>rapies withincreased clinical efficacy. This study provides <strong>the</strong> first evidence that<strong>the</strong> differences in acute and chronic effects <strong>of</strong> an SSRI can beobserved through phMRI.References(1) Elhwuegi, Progress in Neuro-Psychopharmacology &BiologicalPsychiatry 28, 435 – 451 (2004)(2) Czachura and Rasmussen, Naunyn Schmiedeberg’s Arch.Pharmacol. 362, 266 – 275 (2000)(3) Kreiss and Lucki, J. Pharmacol. Exp. Ther. 274, 866 - 76 (1995)(4) Riad et al J. Neuroscience 24, 5420 – 6 (2004)(5) Bandettiini et al Mag. Reson. Med. 25, 390 – 397 (1992)(6) Li et al J Pharmacol. Exp. Ther. 279, 1035 – 1042 (1996)bThis project was funded by a BBSRC Case Studentship in conjunctionwith Eli Lilly & Co. Surrey, U.K.Figure 1: The effects <strong>of</strong> acute fluoxetine dosing. SPM {t} distributionmaps <strong>of</strong> BOLD signal change overlaid onto co-registered spin echoanatomical templates, a) shows results for <strong>the</strong> vehicle group, b) shows<strong>the</strong> results for <strong>the</strong> drug group. Coloured pixels represent significantcorrelation (thresholded at p < 0.05 corrected for multiple comparisons,T > 4.28) <strong>of</strong> signal timecourse with pharmacokinetic pr<strong>of</strong>ile <strong>of</strong>fluoxetine. Red = positive correlation, blue = negative correlation,vehicle group n=10 drug group n=8.
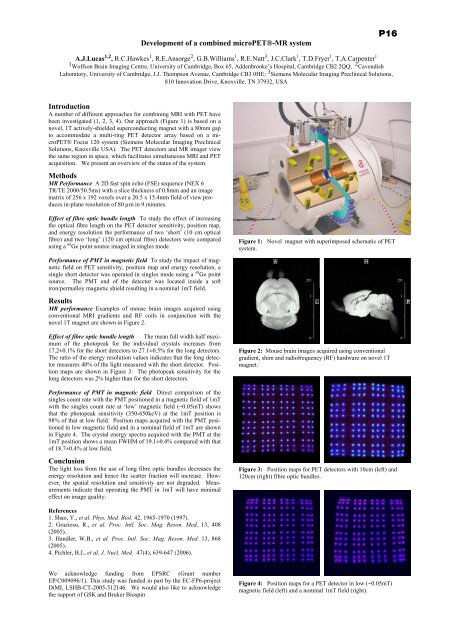
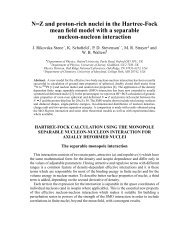
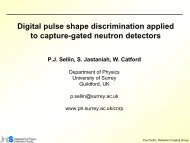
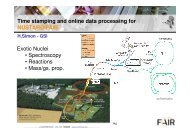
Development <strong>of</strong> a combined microPET®-MR systemP16A.J.Lucas 1,2 , R.C.Hawkes 1 , R.E.Ansorge 2 , G.B.Williams 1 , R.E.Nutt 3 , J.C.Clark 1 , T.D.Fryer 1 , T.A.Carpenter 11 Wolfson Brain Imaging Centre, <strong>University</strong> <strong>of</strong> Cambridge, Box 65, Addenbrooke’s Hospital, Cambridge CB2 2QQ; 2 CavendishLaboratory, <strong>University</strong> <strong>of</strong> Cambridge, J.J. Thompson Avenue, Cambridge CB3 0HE; 3 Siemens Molecular Imaging Preclinical Solutions,810 Innovation Drive, Knoxville, TN 37932, USAIntroductionA number <strong>of</strong> different approaches for combining MRI with PET havebeen investigated (1, 2, 3, 4). Our approach (Figure 1) is based on anovel, 1T actively-shielded superconducting magnet with a 80mm gapto accommodate a multi-ring PET detector array based on a microPET®Focus 120 system (Siemens Molecular Imaging PreclinicalSolutions, Knoxville USA). The PET detectors and MR imager view<strong>the</strong> same region in space, which facilitates simultaneous MRI and PETacquisition. We present an overview <strong>of</strong> <strong>the</strong> status <strong>of</strong> <strong>the</strong> system.MethodsMR Performance A 2D fast spin echo (FSE) sequence (NEX 6TR/TE 2000/50.5ms) with a slice thickness <strong>of</strong> 0.8mm and an imagematrix <strong>of</strong> 256 x 192 voxels over a 20.5 x 15.4mm field <strong>of</strong> view producesin-plane resolution <strong>of</strong> 80 µm in 9 minutes.Effect <strong>of</strong> fibre optic bundle length To study <strong>the</strong> effect <strong>of</strong> increasing<strong>the</strong> optical fibre length on <strong>the</strong> PET detector sensitivity, position map,and energy resolution <strong>the</strong> performance <strong>of</strong> two ‘short’ (10 cm opticalfibre) and two ‘long’ (120 cm optical fibre) detectors were comparedusing a 68 Ge point source imaged in singles mode.Performance <strong>of</strong> PMT in magnetic field To study <strong>the</strong> impact <strong>of</strong> magneticfield on PET sensitivity, position map and energy resolution, asingle short detector was operated in singles mode using a 68 Ge pointsource. The PMT end <strong>of</strong> <strong>the</strong> detector was located inside a s<strong>of</strong>tiron/permalloy magnetic shield resulting in a nominal 1mT field.ResultsMR performance Examples <strong>of</strong> mouse brain images acquired usingconventional MRI gradients and RF coils in conjunction with <strong>the</strong>novel 1T magnet are shown in Figure 2.Effect <strong>of</strong> fibre optic bundle length The mean full width half maximum<strong>of</strong> <strong>the</strong> photopeak for <strong>the</strong> individual crystals increases from17.2±0.1% for <strong>the</strong> short detectors to 27.1±0.5% for <strong>the</strong> long detectors.The ratio <strong>of</strong> <strong>the</strong> energy resolution values indicates that <strong>the</strong> long detectormeasures 40% <strong>of</strong> <strong>the</strong> light measured with <strong>the</strong> short detector. Positionmaps are shown in Figure 3. The photopeak sensitivity for <strong>the</strong>long detectors was 2% higher than for <strong>the</strong> short detectors.Performance <strong>of</strong> PMT in magnetic field Direct comparison <strong>of</strong> <strong>the</strong>singles count rate with <strong>the</strong> PMT positioned in a magnetic field <strong>of</strong> 1mTwith <strong>the</strong> singles count rate at ‘low’ magnetic field (~0.05mT) showsthat <strong>the</strong> photopeak sensitivity (350-650keV) at <strong>the</strong> 1mT position is98% <strong>of</strong> that at low field. Position maps acquired with <strong>the</strong> PMT positionedin low magnetic field and in a nominal field <strong>of</strong> 1mT are shownin Figure 4. The crystal energy spectra acquired with <strong>the</strong> PMT at <strong>the</strong>1mT position shows a mean FWHM <strong>of</strong> 19.1±0.4% compared with that<strong>of</strong> 18.7±0.4% at low field.ConclusionThe light loss from <strong>the</strong> use <strong>of</strong> long fibre optic bundles decreases <strong>the</strong>energy resolution and hence <strong>the</strong> scatter fraction will increase. However,<strong>the</strong> spatial resolution and sensitivity are not degraded. Measurementsindicate that operating <strong>the</strong> PMT in 1mT will have minimaleffect on image quality.Figure 1: Novel magnet with superimposed schematic <strong>of</strong> PETsystem.Figure 2: Mouse brain images acquired using conventionalgradient, shim and radi<strong>of</strong>requency (RF) hardware on novel 1Tmagnet.Figure 3: Position maps for PET detectors with 10cm (left) and120cm (right) fibre optic bundles.References1. Shao, Y., et al. Phys. Med. Biol. 42, 1965-1970 (1997).2. Grazioso, R., et al. Proc. Intl. Soc. Mag. Reson. Med. 13, 408(2005).3. Handler, W.B., et al. Proc. Intl. Soc. Mag. Reson. Med. 13, 868(2005).4. Pichler, B.J., et al. J. Nucl. Med. 47(4), 639-647 (2006).We acknowledge funding from EPSRC (Grant numberEP/C009096/1). This study was funded in part by <strong>the</strong> EC-FP6-projectDiMI, LSHB-CT-2005-512146. We would also like to acknowledge<strong>the</strong> support <strong>of</strong> GSK and Bruker BiospinFigure 4: Position maps for a PET detector in low (~0.05mT)magnetic field (left) and a nominal 1mT field (right).