Proceedings of the meeting - Department of Physics - University of ...
Proceedings of the meeting - Department of Physics - University of ...
Proceedings of the meeting - Department of Physics - University of ...
You also want an ePaper? Increase the reach of your titles
YUMPU automatically turns print PDFs into web optimized ePapers that Google loves.
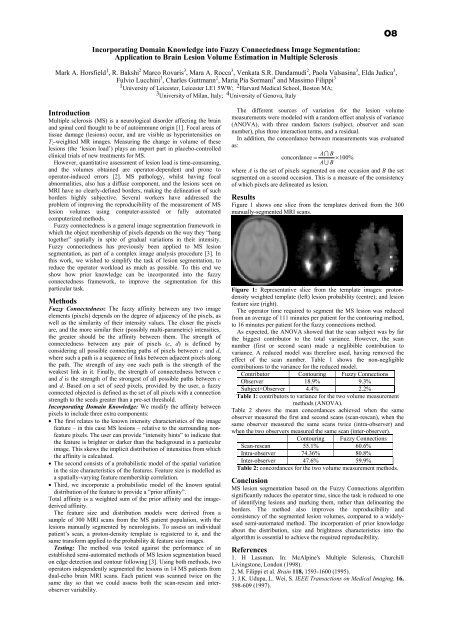
O8Incorporating Domain Knowledge into Fuzzy Connectedness Image Segmentation:Application to Brain Lesion Volume Estimation in Multiple SclerosisMark A. Horsfield 1 , R. Bakshi 2 Marco Rovaris 3 , Mara A. Rocca 3 , Venkata S.R. Dandamudi 2 , Paola Valsasina 3 , Elda Judica 3 ,Fulvio Lucchini 3 , Charles Guttmann 2 , Maria Pia Sormani 4 and Massimo Filippi 31 <strong>University</strong> <strong>of</strong> Leicester, Leicester LE1 5WW; 2 Harvard Medical School, Boston MA;3 <strong>University</strong> <strong>of</strong> Milan, Italy; 4 <strong>University</strong> <strong>of</strong> Genova, ItalyIntroductionMultiple sclerosis (MS) is a neurological disorder affecting <strong>the</strong> brainand spinal cord thought to be <strong>of</strong> autoimmune origin [1]. Focal areas <strong>of</strong>tissue damage (lesions) occur, and are visible as hyperintensities onT 2 -weighted MR images. Measuring <strong>the</strong> change in volume <strong>of</strong> <strong>the</strong>selesions (<strong>the</strong> ‘lesion load’) plays an import part in placebo-controlledclinical trials <strong>of</strong> new treatments for MS.However, quantitative assessment <strong>of</strong> lesion load is time-consuming,and <strong>the</strong> volumes obtained are operator-dependent and prone tooperator-induced errors [2]. MS pathology, whilst having focalabnormalities, also has a diffuse component, and <strong>the</strong> lesions seen onMRI have no clearly-defined borders, making <strong>the</strong> delineation <strong>of</strong> suchborders highly subjective. Several workers have addressed <strong>the</strong>problem <strong>of</strong> improving <strong>the</strong> reproducibility <strong>of</strong> <strong>the</strong> measurement <strong>of</strong> MSlesion volumes using computer-assisted or fully automatedcomputerized methods.Fuzzy connectedness is a general image segmentation framework inwhich <strong>the</strong> object membership <strong>of</strong> pixels depends on <strong>the</strong> way <strong>the</strong>y “hangtoge<strong>the</strong>r” spatially in spite <strong>of</strong> gradual variations in <strong>the</strong>ir intensity.Fuzzy connectedness has previously been applied to MS lesionsegmentation, as part <strong>of</strong> a complex image analysis procedure [3]. Inthis work, we wished to simplify <strong>the</strong> task <strong>of</strong> lesion segmentation, toreduce <strong>the</strong> operator workload as much as possible. To this end weshow how prior knowledge can be incorporated into <strong>the</strong> fuzzyconnectedness framework, to improve <strong>the</strong> segmentation for thisparticular task.MethodsFuzzy Connectedness: The fuzzy affinity between any two imageelements (pixels) depends on <strong>the</strong> degree <strong>of</strong> adjacency <strong>of</strong> <strong>the</strong> pixels, aswell as <strong>the</strong> similarity <strong>of</strong> <strong>the</strong>ir intensity values. The closer <strong>the</strong> pixelsare, and <strong>the</strong> more similar <strong>the</strong>ir (possibly multi-parametric) intensities,<strong>the</strong> greater should be <strong>the</strong> affinity between <strong>the</strong>m. The strength <strong>of</strong>connectedness between any pair <strong>of</strong> pixels (c, d) is defined byconsidering all possible connecting paths <strong>of</strong> pixels between c and d,where such a path is a sequence <strong>of</strong> links between adjacent pixels along<strong>the</strong> path. The strength <strong>of</strong> any one such path is <strong>the</strong> strength <strong>of</strong> <strong>the</strong>weakest link in it. Finally, <strong>the</strong> strength <strong>of</strong> connectedness between cand d is <strong>the</strong> strength <strong>of</strong> <strong>the</strong> strongest <strong>of</strong> all possible paths between cand d. Based on a set <strong>of</strong> seed pixels, provided by <strong>the</strong> user, a fuzzyconnected objected is defined as <strong>the</strong> set <strong>of</strong> all pixels with a connectionstrength to <strong>the</strong> seeds greater than a pre-set threshold.Incorporating Domain Knowledge: We modify <strong>the</strong> affinity betweenpixels to include three extra components:• The first relates to <strong>the</strong> known intensity characteristics <strong>of</strong> <strong>the</strong> imagefeature – in this case MS lesions – relative to <strong>the</strong> surrounding nonfeaturepixels. The user can provide “intensity hints” to indicate that<strong>the</strong> feature is brighter or darker than <strong>the</strong> background in a particularimage. This skews <strong>the</strong> implicit distribution <strong>of</strong> intensities from which<strong>the</strong> affinity is calculated.• The second consists <strong>of</strong> a probabilistic model <strong>of</strong> <strong>the</strong> spatial variationin <strong>the</strong> size characteristics <strong>of</strong> <strong>the</strong> features. Feature size is modelled asa spatially-varying feature membership correlation.• Third, we incorporate a probabilistic model <strong>of</strong> <strong>the</strong> known spatialdistribution <strong>of</strong> <strong>the</strong> feature to provide a “prior affinity”.Total affinity is a weighted sum <strong>of</strong> <strong>the</strong> prior affinity and <strong>the</strong> imagederivedaffinity.The feature size and distribution models were derived from asample <strong>of</strong> 300 MRI scans from <strong>the</strong> MS patient population, with <strong>the</strong>lesions manually segmented by neurologists. To assess an individualpatient’s scan, a proton-density template is registered to it, and <strong>the</strong>same transform applied to <strong>the</strong> probability & feature size images.Testing: The method was tested against <strong>the</strong> performance <strong>of</strong> anestablished semi-automated methods <strong>of</strong> MS lesion segmentation basedon edge detection and contour following [3]. Using both methods, twooperators independently segmented <strong>the</strong> lesions in 14 MS patients fromdual-echo brain MRI scans. Each patient was scanned twice on <strong>the</strong>same day so that we could assess both <strong>the</strong> scan-rescan and interobservervariability.The different sources <strong>of</strong> variation for <strong>the</strong> lesion volumemeasurements were modeled with a random effect analysis <strong>of</strong> variance(ANOVA), with three random factors (subject, observer and scannumber), plus three interaction terms, and a residual.In addition, <strong>the</strong> concordance between measurements was evaluatedas:A ∩ Bconcordanc e = × 100%A ∪ Bwhere A is <strong>the</strong> set <strong>of</strong> pixels segmented on one occasion and B <strong>the</strong> setsegmented on a second occasion. This is a measure <strong>of</strong> <strong>the</strong> consistency<strong>of</strong> which pixels are delineated as lesion.ResultsFigure 1 shows one slice from <strong>the</strong> templates derived from <strong>the</strong> 300manually-segmented MRI scans.Figure 1: Representative slice from <strong>the</strong> template images: protondensityweighted template (left) lesion probability (centre); and lesionfeature size (right).The operator time required to segment <strong>the</strong> MS lesion was reducedfrom an average <strong>of</strong> 111 minutes per patient for <strong>the</strong> contouring method,to 16 minutes per patient for <strong>the</strong> fuzzy connections method.As expected, <strong>the</strong> ANOVA showed that <strong>the</strong> scan subject was by far<strong>the</strong> biggest contributor to <strong>the</strong> total variance. However, <strong>the</strong> scannumber (first or second scan) made a neglibible contribution tovariance. A reduced model was <strong>the</strong>refore used, having removed <strong>the</strong>effect <strong>of</strong> <strong>the</strong> scan number. Table 1 shows <strong>the</strong> non-negligiblecontributions to <strong>the</strong> variance for <strong>the</strong> reduced model.Contributor Contouring Fuzzy ConnectionsObserver 18.9% 9.3%Subject×Observer 4.4% 2.2%Table 1: contributors to variance for <strong>the</strong> two volume measurementmethods (ANOVA).Table 2 shows <strong>the</strong> mean concordances achieved when <strong>the</strong> sameobserver measured <strong>the</strong> first and second scans (scan-rescan), when <strong>the</strong>same observer measured <strong>the</strong> same scans twice (intra-observer) andwhen <strong>the</strong> two observers measured <strong>the</strong> same scan (inter-observer).Contouring Fuzzy ConnectionsScan-rescan 55.1% 60.6%Intra-observer 74.36% 80.8%Inter-observer 47.6% 59.9%Table 2: concordances for <strong>the</strong> two volume measurement methods.ConclusionMS lesion segmentation based on <strong>the</strong> Fuzzy Connections algorithmsignificantly reduces <strong>the</strong> operator time, since <strong>the</strong> task is reduced to one<strong>of</strong> identifying lesions and marking <strong>the</strong>m, ra<strong>the</strong>r than delineating <strong>the</strong>borders. The method also improves <strong>the</strong> reproducibility andconsistency <strong>of</strong> <strong>the</strong> segmented lesion volumes, compared to a widelyusedsemi-automated method. The incorporation <strong>of</strong> prior knowledgeabout <strong>the</strong> distribution, size and brightness characteristics into <strong>the</strong>algorithm is essential to achieve <strong>the</strong> required reproducibility.References1. H Lassman. In: McAlpine's Multiple Sclerosis, ChurchillLivingstone, London (1998).2. M. Filippi et al. Brain 118, 1593-1600 (1995).3. J.K. Udupa, L. Wei, S. IEEE Transactions on Medical Imaging. 16,598-609 (1997).


