Proceedings of the meeting - Department of Physics - University of ...
Proceedings of the meeting - Department of Physics - University of ...
Proceedings of the meeting - Department of Physics - University of ...

Create successful ePaper yourself
Turn your PDF publications into a flip-book with our unique Google optimized e-Paper software.
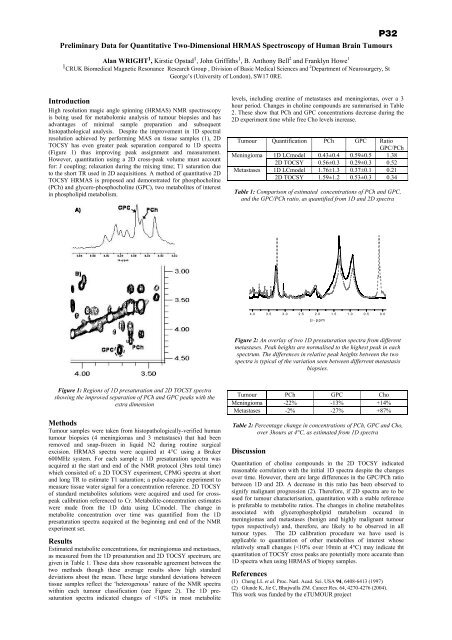
Preliminary Data for Quantitative Two-Dimensional HRMAS Spectroscopy <strong>of</strong> Human Brain TumoursAlan WRIGHT 1 , Kirstie Opstad 1 , John Griffiths 1 , B. Anthony Bell 2 and Franklyn Howe 11 CRUK Biomedical Magnetic Resonance Research Group , Division <strong>of</strong> Basic Medical Sciences and 2 <strong>Department</strong> <strong>of</strong> Neurosurgery, StGeorge’s (<strong>University</strong> <strong>of</strong> London), SW17 0RE.P32IntroductionHigh resolution magic angle spinning (HRMAS) NMR spectroscopyis being used for metabolomic analysis <strong>of</strong> tumour biopsies and hasadvantages <strong>of</strong> minimal sample preparation and subsequenthistopathological analysis. Despite <strong>the</strong> improvement in 1D spectralresolution achieved by performing MAS on tissue samples (1), 2DTOCSY has even greater peak separation compared to 1D spectra(Figure 1) thus improving peak assignment and measurement.However, quantitation using a 2D cross-peak volume must accountfor: J coupling; relaxation during <strong>the</strong> mixing time; T1 saturation dueto <strong>the</strong> short TR used in 2D acquisitions. A method <strong>of</strong> quantitative 2DTOCSY HRMAS is proposed and demonstrated for phosphocholine(PCh) and glycero-phosphocholine (GPC), two metabolites <strong>of</strong> interestin phospholipid metabolism.levels, including creatine <strong>of</strong> metastases and meningiomas, over a 3hour period. Changes in choline compounds are summarised in Table2. These show that PCh and GPC concentrations decrease during <strong>the</strong>2D experiment time while free Cho levels increase.Tumour Quantification PCh GPC RatioGPC/PChMeningioma 1D LCmodel 0.43±0.4 0.59±0.5 1.382D TOCSY 0.56±0.3 0.29±0.3 0.52Metastases 1D LCmodel 1.76±1.3 0.37±0.1 0.212D TOCSY 1.59±1.2 0.53±0.3 0.34Table 1: Comparison <strong>of</strong> estimated concentrations <strong>of</strong> PCh and GPC,and <strong>the</strong> GPC/PCh ratio, as quantified from 1D and 2D spectra4.0 3.5 3.0 2.5 2.0 1.5 1.0 0.5 0.0Ω−ppmFigure 2: An overlay <strong>of</strong> two 1D presaturation spectra from differentmetastases. Peak heights are normalised to <strong>the</strong> highest peak in eachspectrum. The differences in relative peak heights between <strong>the</strong> twospectra is typical <strong>of</strong> <strong>the</strong> variation seen between differrent metastasisbiopsies.Figure 1: Regions <strong>of</strong> 1D presaturation and 2D TOCSY spectrashowing <strong>the</strong> improved separation <strong>of</strong> PCh and GPC peaks with <strong>the</strong>extra dimensionMethodsTumour samples were taken from histopathologically-verified humantumour biopsies (4 meningiomas and 3 metastases) that had beenremoved and snap-frozen in liquid N2 during routine surgicalexcision. HRMAS spectra were acquired at 4°C using a Bruker600MHz system. For each sample a 1D presaturation spectra wasacquired at <strong>the</strong> start and end <strong>of</strong> <strong>the</strong> NMR protocol (3hrs total time)which consisted <strong>of</strong>: a 2D TOCSY experiment, CPMG spectra at shortand long TR to estimate T1 saturation; a pulse-acquire experiment tomeasure tissue water signal for a concentration reference. 2D TOCSY<strong>of</strong> standard metabolites solutions were acquired and used for crosspeakcalibration referenced to Cr. Metabolite-concentration estimateswere made from <strong>the</strong> 1D data using LCmodel. The change inmetabolite concentration over time was quantified from <strong>the</strong> 1Dpresaturation spectra acquired at <strong>the</strong> beginning and end <strong>of</strong> <strong>the</strong> NMRexperiment set.ResultsEstimated metabolite concentrations, for meningiomas and metastases,as measured from <strong>the</strong> 1D presaturation and 2D TOCSY spectrum, aregiven in Table 1. These data show reasonable agreement between <strong>the</strong>two methods though <strong>the</strong>se average results show high standarddeviations about <strong>the</strong> mean. These large standard deviations betweentissue samples reflect <strong>the</strong> ‘heterogenous’ nature <strong>of</strong> <strong>the</strong> NMR spectrawithin each tumour classification (see Figure 2). The 1D presaturationspectra indicated changes <strong>of</strong>