Audit of Substance Abuse Treatment Facilities in ... - SA HealthInfo
Audit of Substance Abuse Treatment Facilities in ... - SA HealthInfo
Audit of Substance Abuse Treatment Facilities in ... - SA HealthInfo
- No tags were found...

You also want an ePaper? Increase the reach of your titles
YUMPU automatically turns print PDFs into web optimized ePapers that Google loves.
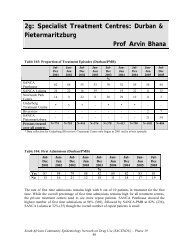
services per month ranges from 13 to 50 (χ = 32.0, SD = 26.2). In Mpumalanga, thetypical number <strong>of</strong> clients receiv<strong>in</strong>g substance abuse treatment services per month rangesfrom 33 to 721 (χ = 268.0, SD = 392.4). In North West, the typical number <strong>of</strong> clientsreceiv<strong>in</strong>g substance abuse treatment services per month is 33 (χ = 33.0, SD = 0.0). F<strong>in</strong>ally<strong>in</strong> Northern Cape, the typical number <strong>of</strong> clients receiv<strong>in</strong>g substance abuse treatmentservices per month ranges from 96 to 175 (χ = 136.0, SD = 55.9).3.3.2. <strong>Treatment</strong> capacity at substance abuse treatment facilitiesIn this study, treatment capacity refers to the number <strong>of</strong> treatment slots available to treatclients. For the overall sample, annual treatment capacity ranges from 10 to 862 slots (χ= 225.2, SD = 243.5). When prov<strong>in</strong>cial data are considered separately, annual treatmentcapacity ranges from 10 to 120 slots <strong>in</strong> Free State (χ = 62.6, SD = 43.2); from 48 to 105slots <strong>in</strong> Limpopo (χ = 76.5, SD = 40.3); from 180 to 862 slots <strong>in</strong> Mpumalanga (χ = 479.0,SD = 348.7); and 450 slots <strong>in</strong> both North West and Northern Cape (χ = 450.0, SD = 0.0).3.3.3. <strong>Substance</strong> abuse treatment occupancy ratesFor the overall sample, the average proportion <strong>of</strong> occupied treatment slots ranges from12.0% to 100.0% (χ = 69.4, SD = 27.8). North West has the highest average proportion <strong>of</strong>occupied treatment slots, 97.0% (χ = 97.0, SD = 0.0) (Table 4).Table 4. Proportion <strong>of</strong> treatment slots occupied by prov<strong>in</strong>ce (%).Prov<strong>in</strong>ce M<strong>in</strong>. Max. χ SDFree State 12 100 67.4 28.0Limpopo 90 90 90.0 0.0Mpumalanga 25 60 38.3 18.9North West 97 97 97.0 0.0Northern Cape 80 80 80.0 0.03.3.4. Wait<strong>in</strong>g period for treatment services at substance abuse facilities <strong>in</strong> FreeState, Limpopo, Mpumalanga, North West and Northern CapeFor the overall sample, 46.7% (7) facilities use a wait<strong>in</strong>g list when full to capacity (1facility did not provide a response). When wait<strong>in</strong>g lists were exam<strong>in</strong>ed by prov<strong>in</strong>ce, <strong>in</strong>Free State, 42.9% (3) <strong>of</strong> facilities use a wait<strong>in</strong>g list; 50.0% (1) <strong>in</strong> Limpopo; 33.3% (1) <strong>in</strong>35