Prudential Asia Prudential Asia
Prudential Asia Prudential Asia
Prudential Asia Prudential Asia

Create successful ePaper yourself
Turn your PDF publications into a flip-book with our unique Google optimized e-Paper software.
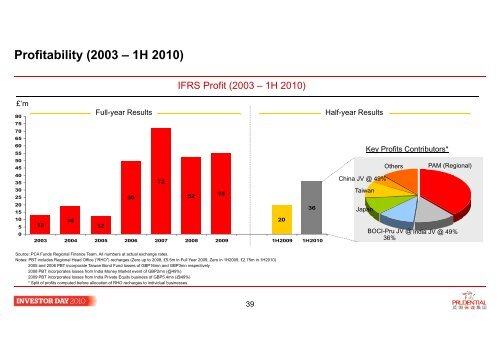
Profitability (2003 – 1H 2010)IFRS Profit (2003 – 1H 2010)£’m80757065605550454035302520151050Full-year Results7255505236192013 122003 2004 2005 2006 2007 2008 2009 1H2009 1H2010Half-year ResultsKey Profits Contributors*Others PAM (Regional)China JV @ 49%TaiwanJapanBOCI-Pru JV @ India JV @ 49%36%Source: PCA Funds Regional Finance Team. All numbers at actual exchange rates.Notes: PBT includes Regional Head Office (“RHO”) recharges (Zero up to 2008, £5.5m in Full Year 2009, Zero in 1H2009, £2.75m in 1H2010)2005 and 2006 PBT incorporate Taiwan Bond Fund losses of GBP16mn and GBP3mn respectively2008 PBT incorporates losses from India Money Market event of GBP2mn (@49%)2009 PBT incorporates losses from India Private Equity business of GBP5.4mn (@49%)* Split of profits computed before allocation of RHO recharges to individual businesses39