Prudential Asia Prudential Asia
Prudential Asia Prudential Asia
Prudential Asia Prudential Asia

You also want an ePaper? Increase the reach of your titles
YUMPU automatically turns print PDFs into web optimized ePapers that Google loves.
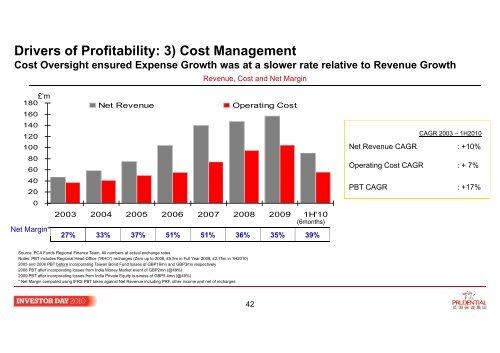
Drivers of Profitability: 3) Cost ManagementCost Oversight ensured Expense Growth was at a slower rate relative to Revenue GrowthRevenue, Cost and Net Margin£’m180 Net Revenue Operating Cost160140120100806040200Net Margin*2003 2004 2005 2006 2007 2008 2009 1H'10(6months)27% 33% 37% 51% 51% 36% 35% 39%CAGR 2003 – 1H2010Net Revenue CAGR: +10%Operating Cost CAGR : + 7%PBT CAGR: +17%Source: PCA Funds Regional Finance Team. All numbers at actual exchange rates.Notes: PBT includes Regional Head Office (“RHO”) recharges (Zero up to 2008, £5.5m in Full Year 2009, £2.75m in 1H2010)2005 and 2006 PBT before incorporating Taiwan Bond Fund losses of GBP16mn and GBP3mn respectively2008 PBT after incorporating losses from India Money Market event of GBP2mn (@49%)2009 PBT after incorporating losses from India Private Equity business of GBP5.4mn (@49%)* Net Margin computed using IFRS PBT taken against Net Revenue including PRF, other income and net of recharges42