Prudential Asia Prudential Asia
Prudential Asia Prudential Asia
Prudential Asia Prudential Asia

Create successful ePaper yourself
Turn your PDF publications into a flip-book with our unique Google optimized e-Paper software.
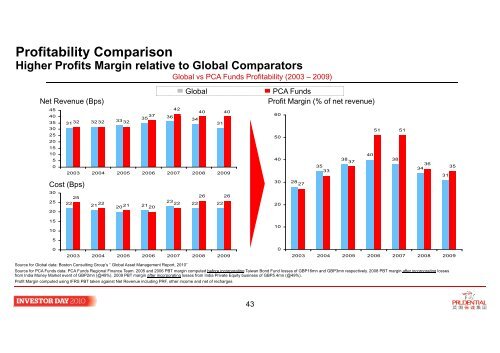
Profitability ComparisonHigher Profits Margin relative to Global ComparatorsGlobal vs PCA Funds Profitability (2003 – 2009)GlobalNet Revenue (Bps)454240 40403735 3631 32 333435 32 32 32313025201510502003 2004 2005 2006 2007 2008 2009Cost (Bps)302526 2625232221222021 21222022 2220PCA FundsProfit Margin (% of net revenue)6051 5150404038 3837353330 28272036343135151010502003 2004 2005 2006 2007 2008 200902003 2004 2005 2006 2007 2008 2009Source for Global data: Boston Consulting Group’s “ Global Asset Management Report, 2010”Source for PCA Funds data: PCA Funds Regional Finance Team. 2005 and 2006 PBT margin computed before incorporating Taiwan Bond Fund losses of GBP16mn and GBP3mn respectively. 2008 PBT margin after incorporating lossesfrom India Money Market event of GBP2mn (@49%). 2009 PBT margin after incorporating losses from India Private Equity business of GBP5.4mn (@49%).Profit Margin computed using IFRS PBT taken against Net Revenue including PRF, other income and net of recharges43