Tuolumne River Report - U.S. Fish and Wildlife Service
Tuolumne River Report - U.S. Fish and Wildlife Service
Tuolumne River Report - U.S. Fish and Wildlife Service

Create successful ePaper yourself
Turn your PDF publications into a flip-book with our unique Google optimized e-Paper software.
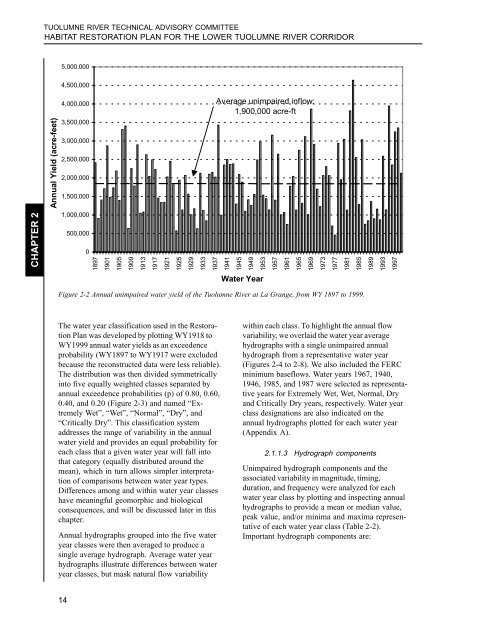
TUOLUMNE RIVER TECHNICAL ADVISORY COMMITTEEHABITAT RESTORATION PLAN FOR THE LOWER TUOLUMNE RIVER CORRIDOR5,000,0004,500,000Annual Yield (acre-feet)4,000,0003,500,0003,000,0002,500,0002,000,0001,500,000Average unimpaired inflow:1,900,000 acre-ftCHAPTER 21,000,000500,000018971901190519091913191719211925192919331937194119451949195319571961196519691973197719811985198919931997Water YearFigure 2-2 Annual unimpaired water yield of the <strong>Tuolumne</strong> <strong>River</strong> at La Grange, from WY 1897 to 1999.The water year classification used in the RestorationPlan was developed by plotting WY1918 toWY1999 annual water yields as an exceedenceprobability (WY1897 to WY1917 were excludedbecause the reconstructed data were less reliable).The distribution was then divided symmetricallyinto five equally weighted classes separated byannual exceedence probabilities (p) of 0.80, 0.60,0.40, <strong>and</strong> 0.20 (Figure 2-3) <strong>and</strong> named “ExtremelyWet”, “Wet”, “Normal”, “Dry”, <strong>and</strong>“Critically Dry”. This classification systemaddresses the range of variability in the annualwater yield <strong>and</strong> provides an equal probability foreach class that a given water year will fall intothat category (equally distributed around themean), which in turn allows simpler interpretationof comparisons between water year types.Differences among <strong>and</strong> within water year classeshave meaningful geomorphic <strong>and</strong> biologicalconsequences, <strong>and</strong> will be discussed later in thischapter.Annual hydrographs grouped into the five wateryear classes were then averaged to produce asingle average hydrograph. Average water yearhydrographs illustrate differences between wateryear classes, but mask natural flow variabilitywithin each class. To highlight the annual flowvariability, we overlaid the water year averagehydrographs with a single unimpaired annualhydrograph from a representative water year(Figures 2-4 to 2-8). We also included the FERCminimum baseflows. Water years 1967, 1940,1946, 1985, <strong>and</strong> 1987 were selected as representativeyears for Extremely Wet, Wet, Normal, Dry<strong>and</strong> Critically Dry years, respectively. Water yearclass designations are also indicated on theannual hydrographs plotted for each water year(Appendix A).2.1.1.3 Hydrograph componentsUnimpaired hydrograph components <strong>and</strong> theassociated variability in magnitude, timing,duration, <strong>and</strong> frequency were analyzed for eachwater year class by plotting <strong>and</strong> inspecting annualhydrographs to provide a mean or median value,peak value, <strong>and</strong>/or minima <strong>and</strong> maxima representativeof each water year class (Table 2-2).Important hydrograph components are:14