- Page 1 and 2:
ASRemlUser GuideRelease 2.0A R Gilm
- Page 3 and 4:
Published by:E-mail:Website:VSN Int
- Page 5 and 6:
PrefaceiiASReml is one of several u
- Page 7 and 8:
ContentsPrefaceiList of TablesxviiL
- Page 9 and 10:
Contentsvi3.3 The ASReml data file
- Page 11 and 12:
ContentsviiiCombining rows from sep
- Page 13 and 14:
Contentsx7.6 Variance structure qua
- Page 15 and 16:
Contentsxii12.2 The command line .
- Page 17 and 18:
Contentsxiv15 Examples 24115.1 Intr
- Page 19:
List of Tablesxvi7.3 Details of the
- Page 22 and 23:
List of Figuresxix15.8 Rice bloodwo
- Page 24 and 25:
1 Introduction 21.1 What ASReml can
- Page 26 and 27:
1 Introduction 41.4 How to use this
- Page 28 and 29:
2 Some theoryThe linear mixed model
- Page 30 and 31:
2 Some theory 8laid out in a rectan
- Page 32 and 33:
2 Some theory 10product of matrices
- Page 34 and 35:
2 Some theory 12where H = R + ZGZ
- Page 36 and 37:
2 Some theory 14where y i is the
- Page 38 and 39:
2 Some theory 162.4 Combining varia
- Page 40 and 41:
2 Some theory 18balanced one-way cl
- Page 42 and 43:
2 Some theory 20L, r × p, and l, r
- Page 44 and 45:
2 Some theory 22the terms A, B, C,
- Page 46 and 47:
2 Some theory 24Kenward and Roger A
- Page 48 and 49:
3 A guided tourIntroductionNebraska
- Page 50 and 51:
3 A guided tour 28column rectangula
- Page 52 and 53:
3 A guided tour 30(see Chapter 2) t
- Page 54 and 55:
3 A guided tour 32els. Similarly fo
- Page 56 and 57:
3 A guided tour 34mand to run nin89
- Page 58 and 59:
3 A guided tour 36* SYNTAX change:
- Page 60 and 61:
3 A guided tour 38repl 3 -0.8713 1.
- Page 62 and 63:
3 A guided tour 40title linenin all
- Page 64 and 65:
4 Data file preparation 424.1 Intro
- Page 66 and 67:
4 Data file preparation 44Fixed for
- Page 68 and 69:
5 Command file: Reading the data 46
- Page 70 and 71:
5 Command file: Reading the data 48
- Page 72 and 73:
5 Command file: Reading the data 50
- Page 74 and 75:
5 Command file: Reading the data 52
- Page 76 and 77:
5 Command file: Reading the data 54
- Page 78 and 79:
5 Command file: Reading the data 56
- Page 80 and 81:
5 Command file: Reading the data 58
- Page 82 and 83:
5 Command file: Reading the data 60
- Page 84 and 85:
5 Command file: Reading the data 62
- Page 86 and 87:
5 Command file: Reading the data 64
- Page 88 and 89:
5 Command file: Reading the data 66
- Page 90 and 91:
5 Command file: Reading the data 68
- Page 92 and 93:
5 Command file: Reading the data 70
- Page 94 and 95:
5 Command file: Reading the data 72
- Page 96 and 97:
5 Command file: Reading the data 74
- Page 98 and 99:
5 Command file: Reading the data 76
- Page 100 and 101:
5 Command file: Reading the data 78
- Page 102 and 103:
5 Command file: Reading the data 80
- Page 104 and 105:
6 Command file: Specifying theterms
- Page 106 and 107:
6 Command file: Specifying the term
- Page 108 and 109:
6 Command file: Specifying the term
- Page 110 and 111:
6 Command file: Specifying the term
- Page 112 and 113:
6 Command file: Specifying the term
- Page 114 and 115:
6 Command file: Specifying the term
- Page 116 and 117:
6 Command file: Specifying the term
- Page 118 and 119:
6 Command file: Specifying the term
- Page 120 and 121:
6 Command file: Specifying the term
- Page 122 and 123:
6 Command file: Specifying the term
- Page 124 and 125:
6 Command file: Specifying the term
- Page 126 and 127:
6 Command file: Specifying the term
- Page 128 and 129:
7 Command file: Specifying variance
- Page 130 and 131:
7 Command file: Specifying variance
- Page 132 and 133:
7 Command file: Specifying variance
- Page 134 and 135:
7 Command file: Specifying variance
- Page 136 and 137:
7 Command file: Specifying variance
- Page 138 and 139:
7 Command file: Specifying variance
- Page 140 and 141:
7 Command file: Specifying variance
- Page 142 and 143:
7 Command file: Specifying variance
- Page 144 and 145:
7 Command file: Specifying variance
- Page 146 and 147:
7 Command file: Specifying variance
- Page 148 and 149:
7 Command file: Specifying variance
- Page 150 and 151:
7 Command file: Specifying variance
- Page 152 and 153:
7 Command file: Specifying variance
- Page 154 and 155:
7 Command file: Specifying variance
- Page 156 and 157:
7 Command file: Specifying variance
- Page 158 and 159:
7 Command file: Specifying variance
- Page 160 and 161:
7 Command file: Specifying variance
- Page 162 and 163:
7 Command file: Specifying variance
- Page 164 and 165:
8 Command file: Multivariate analys
- Page 166 and 167:
8 Command file: Multivariate analys
- Page 168 and 169:
8 Command file: Multivariate analys
- Page 170 and 171:
9 Command file: Genetic analysisInt
- Page 172 and 173:
9 Command file: Genetic analysis 15
- Page 174 and 175:
9 Command file: Genetic analysis 15
- Page 176 and 177:
9 Command file: Genetic analysis 15
- Page 178 and 179:
10 Tabulation of the data andpredic
- Page 180 and 181:
10 Tabulation of the data and predi
- Page 182 and 183:
10 Tabulation of the data and predi
- Page 184 and 185:
10 Tabulation of the data and predi
- Page 186 and 187:
10 Tabulation of the data and predi
- Page 188 and 189:
10 Tabulation of the data and predi
- Page 190 and 191:
10 Tabulation of the data and predi
- Page 192 and 193:
11 Functions of variancecomponentsI
- Page 194 and 195:
11 Functions of variance components
- Page 196 and 197:
11 Functions of variance components
- Page 198 and 199:
12 Command file: Running the jobInt
- Page 200 and 201:
12 Command file: Running the job 17
- Page 202 and 203:
12 Command file: Running the job 18
- Page 204 and 205:
12 Command file: Running the job 18
- Page 206 and 207:
12 Command file: Running the job 18
- Page 208 and 209:
12 Command file: Running the job 18
- Page 210 and 211:
13 Description of output filesIntro
- Page 212 and 213:
13 Description of output files 190A
- Page 214 and 215:
13 Description of output files 192i
- Page 216 and 217:
13 Description of output files 194f
- Page 218 and 219:
13 Description of output files 196.
- Page 220 and 221:
13 Description of output files 198o
- Page 222 and 223:
13 Description of output files 200E
- Page 224 and 225: 13 Description of output files 202t
- Page 226 and 227: 13 Description of output files 204|
- Page 228 and 229: NIN alliance trial 1989 9a 1Residua
- Page 230 and 231: 13 Description of output files 208w
- Page 232 and 233: 13 Description of output files 210T
- Page 234 and 235: 14 Error messagesIntroductionCommon
- Page 236 and 237: 14 Error messages 214filename!last
- Page 238 and 239: 14 Error messages 216variety !AQUAL
- Page 240 and 241: 14 Error messages 2188. misspelt va
- Page 242 and 243: 14 Error messages 220Missing/faulty
- Page 244 and 245: 14 Error messages 222Last line read
- Page 246 and 247: 14 Error messages 224Model specific
- Page 248 and 249: 14 Error messages 226:11 column 11
- Page 250 and 251: 14 Error messages 22814.5 Informati
- Page 252 and 253: 14 Error messages 230List of warnin
- Page 254 and 255: 14 Error messages 232Alphabetical l
- Page 256 and 257: 14 Error messages 234Alphabetical l
- Page 258 and 259: 14 Error messages 236Alphabetical l
- Page 260 and 261: 14 Error messages 238Alphabetical l
- Page 262 and 263: 14 Error messages 240Alphabetical l
- Page 264 and 265: 15 Examples 24215.1 IntroductionIn
- Page 266 and 267: 15 Examples 244For simple variance
- Page 268 and 269: 15 Examples 2460.2_cwt Marvellous 1
- Page 270 and 271: 15 Examples 248The input file conta
- Page 272 and 273: 15 Examples 250Source Model terms G
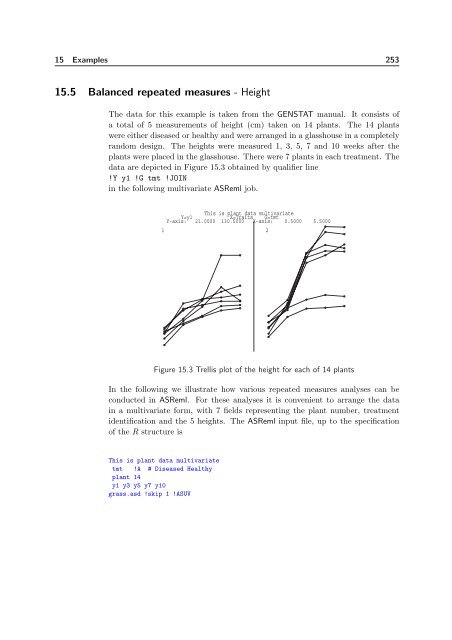
- Page 276 and 277: 15 Examples 254The focus is modelli
- Page 278 and 279: 15 Examples 256y1 y3 y5 y7 y10 ~ Tr
- Page 280 and 281: 15 Examples 258power model shown in
- Page 282 and 283: 15 Examples 260Residual US=UnStr 2
- Page 284 and 285: 15 Examples 262the current model).
- Page 286 and 287: 15 Examples 264Slate Hall example f
- Page 288 and 289: 15 Examples 266Predicted values of
- Page 290 and 291: 15 Examples 268wheat.asd !skip 1 !D
- Page 292 and 293: Tullibigeal trial i2 1Variogram of
- Page 294 and 295: 15 Examples 272column evaluated at
- Page 296 and 297: 15 Examples 274this is for the pair
- Page 298 and 299: 15 Examples 276Table 15.8: Estimate
- Page 300 and 301: 15 Examples 278(and in fact necessa
- Page 302 and 303: 15 Examples 280Tr.run 22 0 US .79 .
- Page 304 and 305: 15 Examples 282Interpretation of re
- Page 306 and 307: 15 Examples 284The independence of
- Page 308 and 309: 15 Examples 286Note that the data f
- Page 310 and 311: 15 Examples 288Table 15.11 Orange d
- Page 312 and 313: 15 Examples 290217Predicted values
- Page 314 and 315: 15 Examples 292105Residual0-5-10200
- Page 316 and 317: 15 Examples 294Table 15.13: REML es
- Page 318 and 319: 15 Examples 29615*0. #Asreml will e
- Page 320 and 321: 15 Examples 298Covariance/Variance/
- Page 322 and 323: 15 Examples 300Eigen values 4.382 0
- Page 324 and 325:
15 Examples 302Animal modelIn this
- Page 326 and 327:
15 Examples 304additive genetic var
- Page 328 and 329:
BibliographyAbramowitz, M. and Steg
- Page 330 and 331:
Bibliography 308Gilmour, A. R., Cul
- Page 332 and 333:
Bibliography 310Schall, R. (1991).
- Page 334 and 335:
IndexABORTASR.NOW, 65FINALASR.NOW,
- Page 336 and 337:
Index 314free format, 42functions o
- Page 338 and 339:
Index 316!==, 53!>, 53!>=, 53!*, 53
- Page 340 and 341:
Index 318!STEP, 71!SUBSET, 71!SUB,
- Page 342:
Index 320parameter, 7variance compo