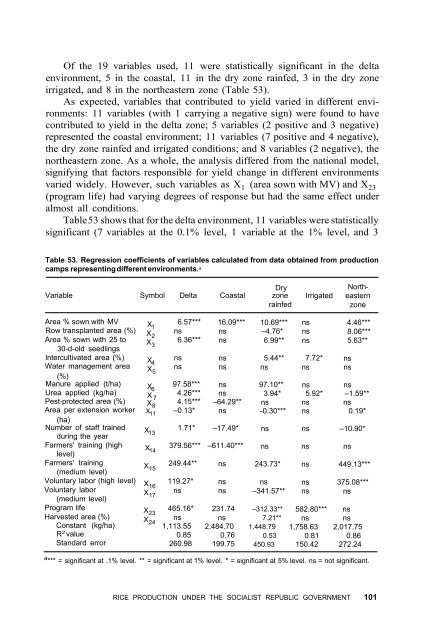
Of the 19 variables used, 11 were statistically significant <strong>in</strong> the deltaenvironment, 5 <strong>in</strong> the coastal, 11 <strong>in</strong> the dry zone ra<strong>in</strong>fed, 3 <strong>in</strong> the dry zoneirrigated, and 8 <strong>in</strong> the northeastern zone (Table 53).As expected, variables that contributed to yield varied <strong>in</strong> different environments:11 variables (with 1 carry<strong>in</strong>g a negative sign) were found to havecontributed to yield <strong>in</strong> the delta zone; 5 variables (2 positive and 3 negative)represented the coastal environment; 11 variables (7 positive and 4 negative),the dry zone ra<strong>in</strong>fed and irrigated conditions; and 8 variables (2 negative), thenortheastern zone. As a whole, the analysis differed from the national model,signify<strong>in</strong>g that factors responsible for yield change <strong>in</strong> different environmentsvaried widely. However, such variables as X 1 (area sown with MV) and X 23(program life) had vary<strong>in</strong>g degrees <strong>of</strong> response but had the same effect underalmost all conditions.Table 53 shows that for the delta environment, 11 variables were statisticallysignificant (7 variables at the 0.1% level, 1 variable at the 1% level, and 3Table 53. Regression coefficients <strong>of</strong> variables calculated from data obta<strong>in</strong>ed from productioncamps represent<strong>in</strong>g different environments. a Dry North-Variable Symbol Delta Coastal zone Irrigated easternra<strong>in</strong>fedzoneArea % sown with MVRow transplanted area (%)Area % sown with 25 to30-d-old seedl<strong>in</strong>gslntercultivated area (%)Water management area(%)Manure applied (t/ha)Urea applied (kg/ha)Pest-protected area (%)Area per extension worker(ha)Number <strong>of</strong> staff tra<strong>in</strong>eddur<strong>in</strong>g the yearFarmers' tra<strong>in</strong><strong>in</strong>g (highlevel)Farmers' tra<strong>in</strong><strong>in</strong>g(medium level)Voluntary labor (high level)Voluntary labor(medium level)Program lifeHarvested area (%)Constant (kg/ha)R 2 valueStandard errorX 6.57***1X ns2X 6.36***3X ns4X ns 5X 97.58***6X 4.26***7X 84.15***X 11 –0.13*X 13X 14X 15X 119.27*16X ns17X 465.16*23X ns241,113.550.85260.9816.09***nsnsnsnsnsns–64.29**ns10.69***–4.76*6.99**5.44**ns97.10**3.94*ns-0.30***nsnsns7.72*nsns5.92*nsns4.46***8.06***5.63**nsnsns–1.59**ns0.19*1.71* –17.49* ns ns –10.90*379.56*** –611.40*** ns ns ns249.44** ns 243.73* ns 449.13***ns nsns –341.57**231.74ns2,484.700.76199.75–312.33**7.21**1,448.790.53450.93nsns375.08***ns582.80*** nsns ns1,758.63 2,017.750.81 0.86150.42 272.24a *** = significant at .1% level. ** = significant at 1% level. * = significant at 5% level. ns = not significant.RICE PRODUCTION UNDER THE SOCIALIST REPUBLIC GOVERNMENT 101
variables at the 5% level) with an 85% coefficient <strong>of</strong> determ<strong>in</strong>ation. The yield<strong>in</strong> the deltas was contributed ma<strong>in</strong>ly by:area sown with MV,area sown with 25- to 30-day-old seedl<strong>in</strong>gs,manure and chemical fertilizer applied,pest-protected area,tra<strong>in</strong><strong>in</strong>g <strong>of</strong> staff and farmers,voluntary labor, andexperience accumulated through program life.Area per extension worker (X 11 ) showed a negative sign. The delta had amean value <strong>of</strong> 1603 ha per extension worker—a relatively large ratio foreffective technology transfer. As <strong>in</strong> the national model, MV, seedl<strong>in</strong>g age, plantprotection, tra<strong>in</strong><strong>in</strong>g, voluntary labor, and program life had a positive <strong>in</strong>fluenceon yield. The analysis po<strong>in</strong>ted out that proper management <strong>of</strong> these factorswas important <strong>in</strong> rais<strong>in</strong>g yield. It was also apparent that as area for MVexpanded, tra<strong>in</strong><strong>in</strong>g <strong>of</strong> extension staff and farmers became more crucial.The factors that contributed to <strong>rice</strong> yield <strong>in</strong> the coastal environment werearea sown with MV and experience dur<strong>in</strong>g the program period. In view <strong>of</strong> thehigh ra<strong>in</strong>fall <strong>in</strong> this area, the other variables rema<strong>in</strong>ed less important as far ascontribution to yield was concerned. Variable X 8 (% pest-protected area) <strong>in</strong> thezone meant a pest-<strong>in</strong>fested area <strong>of</strong> 1-2%, which was well below the averagelevel <strong>of</strong> 10% <strong>in</strong> other zones. Be<strong>in</strong>g equivalent to a pest-<strong>in</strong>fested area, it showeda negative sign. Tra<strong>in</strong><strong>in</strong>g <strong>of</strong> extension staff and farmers did not contribute toyield; they even had a negative effect. This can be expla<strong>in</strong>ed, perhaps, by thefact that dur<strong>in</strong>g the tra<strong>in</strong><strong>in</strong>g period, the extension staff were away from theirduty stations and the farmers were away from their fields. Transportationproblems <strong>in</strong> the coastal regions resulted <strong>in</strong> longer periods <strong>of</strong> absence from thefield. Under such a situation, the tra<strong>in</strong><strong>in</strong>g curriculum and course durationmust be carefully considered.The factors that contributed to <strong>rice</strong> yield <strong>in</strong> the dry zone environment weremore <strong>in</strong>consistent, especially under the dry zone ra<strong>in</strong>fed condition. Under thiscondition, 11 variables significantly contributed to yield; but 7 variablescarried positive signs and 4 had negative signs, with a 53% coefficient <strong>of</strong>determ<strong>in</strong>ation. The seven variables with positive sign—X 1 , X 3 , X 4 , X 6 , X 7 , X 15 , andX 24 —followed the same pattern and exhibited the same phenomenon as didthe variables <strong>in</strong> the delta environment. An exception was X 4 , which was significantonly under the dry zone condition. Intercultivation <strong>in</strong> this environmentled to weed<strong>in</strong>g and chang<strong>in</strong>g the soil physical condition, and constituted animportant impact po<strong>in</strong>t on which to raise yield. Controll<strong>in</strong>g weeds by flood<strong>in</strong>gwas not possible under the limited-ra<strong>in</strong>fall Condition. A better explanation isneeded for variables that carried a negative sign—X 2 , X 11 , X 17 , and X 23 .Rice production <strong>in</strong> this region fell short <strong>of</strong> demand, and deficit forcedfarmers to use marg<strong>in</strong>al areas. The production <strong>of</strong> <strong>rice</strong> was so dependent on102 A CENTURY OF RICE IMPROVEMENT IN BURMA
- Page 3 and 4:
The International Rice Research Ins
- Page 5 and 6:
Rice trading 29Rice milling 29Rice
- Page 8:
ForewordRice dominates Burma’s ec
- Page 11 and 12:
ice production in the last decade.
- Page 14 and 15:
CHAPTER IIntroductionBurma is situa
- Page 16 and 17:
1. Trends in rice area and producti
- Page 18 and 19:
3. Soil distribution.INTRODUCTION 5
- Page 20 and 21:
and the rest of the country in 1885
- Page 22 and 23:
Rice production growth during this
- Page 24 and 25:
4. Rice threshing with cattle.5. Ri
- Page 26 and 27:
7. Transplanting.Farmers classify r
- Page 28:
8. States and Divisions (1-7 are di
- Page 43:
Table 11. Rice mills, 1894-1934 (DA
- Page 51 and 52:
Rice area and productionAlthough th
- Page 53 and 54:
Table 16. Rice production in select
- Page 55 and 56:
Tenants of State Agricultural BankA
- Page 57 and 58:
in 1960, representing a 17% increas
- Page 59:
Table 20. Summary of extension acti
- Page 62 and 63:
Table 24. Rice procurement by diffe
- Page 64 and 65: This trade reduction severely affec
- Page 66: conditions and a weak international
- Page 69 and 70: the design, implementation, and eva
- Page 71 and 72: Table 27 indicates the areas plante
- Page 73 and 74: The coastal zone comprised four ric
- Page 78 and 79: In the meantime, local researchers
- Page 80 and 81: Table 35. Rice area planted, by gra
- Page 83 and 84: All fertilizers were imported until
- Page 85 and 86: points, 3) availability of cash amo
- Page 87 and 88: hispa Hispa armigera. Though annual
- Page 89 and 90: The amounts of agricultural loans g
- Page 91 and 92: from double-cropped areas (Table 44
- Page 93 and 94: when investment in the agricultural
- Page 96 and 97: The program brought research and ex
- Page 98 and 99: Table 46. Average area of responsib
- Page 100 and 101: established practice among farmers,
- Page 102 and 103: 12. Voluntary labor harvesting rice
- Page 104 and 105: of harvesting. It sought voluntary
- Page 106 and 107: nents that a larger project would r
- Page 108 and 109: Table 48. Changes in area planted t
- Page 110 and 111: Table 50. Average yield and product
- Page 112 and 113: Results of analysisOf the variables
- Page 116 and 117: weather that it influenced rice pro
- Page 118 and 119: Table 54. Present level of technolo
- Page 120 and 121: size of holdings, 40% of the prize
- Page 122 and 123: average yield at that time was 2.20
- Page 124 and 125: Table 59. Monthly transactions of t
- Page 126 and 127: Table 61. Irrigated areas for rice,
- Page 128 and 129: Table 62. Tillage operation by trac
- Page 130 and 131: 18. AFPTC rice procurement center.A
- Page 132 and 133: Table 65. Annual rice procurement (
- Page 134 and 135: for seeds; still others sold their
- Page 136 and 137: primarily to help achieve the AFPTC
- Page 138 and 139: Table 67. Annual rice production an
- Page 140 and 141: Table 68. Comparison of paid-out co
- Page 142 and 143: CHAPTER VImplications for the futur
- Page 144 and 145: agricultural research can be brough
- Page 146 and 147: Motivation of scientistsUnder these
- Page 148 and 149: or as individuals. Research is to b
- Page 150 and 151: CHAPTER VIConclusionsBurma’s econ
- Page 152 and 153: References citedAdas M (1974) The B
- Page 154: SRUB—The socialist Republic of th
- Page 157 and 158: Appendix 1 continuedSown area Produ
- Page 159 and 160: Appendix II continuedShareRice a Al
- Page 161 and 162: Appendix IV continuedYear Exports Y
- Page 163 and 164: Appendix VIcontinuedVariable Symbol
- Page 165 and 166:
All combined1977-84 1977-78 1978-79
- Page 167 and 168:
Appendix VIII. Correlation coeffici
- Page 170 and 171:
IndexAdas, M 6Africa 125, 137Agricu
- Page 172 and 173:
farmers 6-9, 13, 18, 23, 25-26, 29,
- Page 174 and 175:
Okpo Small Loan Department110, 111O