A century of rice improvement in Burma - IRRI books - International ...
A century of rice improvement in Burma - IRRI books - International ...
A century of rice improvement in Burma - IRRI books - International ...
- No tags were found...

You also want an ePaper? Increase the reach of your titles
YUMPU automatically turns print PDFs into web optimized ePapers that Google loves.
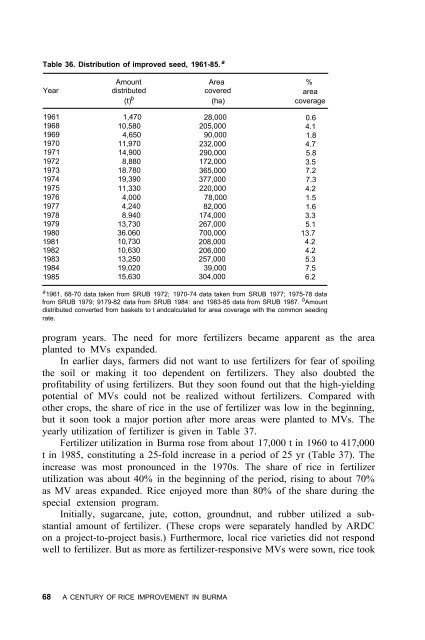
Table 36. Distribution <strong>of</strong> improved seed, 1961-85. aAmount Area %Year distributed coveredarea(t) b(ha)coverage19611968196919701971197219731974197519761977197819791980198119821983198419851,47010,5804,65011,97014,9008,88018.78019,39011,3304,0004,2408.94013,73036.06010,73010,63013,25019,02015,63028,000205,00090,000232,000290,000172,000365,000377,000220,00078,00082,000174,000267,000700,000208,000206,000257,00039,000304,0000.64.11.84.75.83.57.27.34.21.51.63.35.113.74.24.25.37.56.2a 1961, 68-70 data taken from SRUB 1972; 1970-74 data taken from SRUB 1977; 1975-78 datafrom SRUB 1979; 9179-82 data from SRUB 1984: and 1983-85 data from SRUB 1987. b Amountdistributed converted from baskets to t andcalculated for area coverage with the common seed<strong>in</strong>grate.program years. The need for more fertilizers became apparent as the areaplanted to MVs expanded.In earlier days, farmers did not want to use fertilizers for fear <strong>of</strong> spoil<strong>in</strong>gthe soil or mak<strong>in</strong>g it too dependent on fertilizers. They also doubted thepr<strong>of</strong>itability <strong>of</strong> us<strong>in</strong>g fertilizers. But they soon found out that the high-yield<strong>in</strong>gpotential <strong>of</strong> MVs could not be realized without fertilizers. Compared withother crops, the share <strong>of</strong> <strong>rice</strong> <strong>in</strong> the use <strong>of</strong> fertilizer was low <strong>in</strong> the beg<strong>in</strong>n<strong>in</strong>g,but it soon took a major portion after more areas were planted to MVs. Theyearly utilization <strong>of</strong> fertilizer is given <strong>in</strong> Table 37.Fertilizer utilization <strong>in</strong> <strong>Burma</strong> rose from about 17,000 t <strong>in</strong> 1960 to 417,000t <strong>in</strong> 1985, constitut<strong>in</strong>g a 25-fold <strong>in</strong>crease <strong>in</strong> a period <strong>of</strong> 25 yr (Table 37). The<strong>in</strong>crease was most pronounced <strong>in</strong> the 1970s. The share <strong>of</strong> <strong>rice</strong> <strong>in</strong> fertilizerutilization was about 40% <strong>in</strong> the beg<strong>in</strong>n<strong>in</strong>g <strong>of</strong> the period, ris<strong>in</strong>g to about 70%as MV areas expanded. Rice enjoyed more than 80% <strong>of</strong> the share dur<strong>in</strong>g thespecial extension program.Initially, sugarcane, jute, cotton, groundnut, and rubber utilized a substantialamount <strong>of</strong> fertilizer. (These crops were separately handled by ARDCon a project-to-project basis.) Furthermore, local <strong>rice</strong> varieties did not respondwell to fertilizer. But as more as fertilizer-responsive MVs were sown, <strong>rice</strong> took68 A CENTURY OF RICE IMPROVEMENT IN BURMA